
Summary
Western Digital is no longer the company most investors remember. Since the Sandisk flash business was spun off in February 2025, WDC is a pure hard-disk-drive maker, one half of a global duopoly with Seagate, and it has spent the last six quarters selling every nearline drive it can build to hyperscalers that are racing to store what their AI systems produce. Revenue in the quarter ended 2 October 2026 was $4.38B, up 55% year on year, at a GAAP operating margin of 46.7%. The company says it is sold out for calendar 2026, has long-term agreements that reach into 2027 and 2028, and guided the December quarter to $5.1B of revenue at a 60 to 61% gross margin.
The stock has already discounted a great deal of that. It rose from about $45 in January 2025 to a closing high of $746 on 2026-06-18, and has since fallen 51% to $366.11, dropping after each of its last three earnings reports despite beating estimates every time. At $366 the market capitalisation is $137B on a net-cash balance sheet, which is 23.9× trailing operating profit, 17.9× consensus earnings for the fiscal year ending June 2027 and 10.2× the fiscal 2028 consensus.
Our conclusion, built in the Stoxa workbench on point-in-time SEC data, is that $366 already prices the current margin structure as permanent. Our base case, in which the boom runs through 2027 and the duopoly then settles at a 30% operating margin, a level it has never sustained before 2025, is worth about $238 a share. Only the bull case, in which 42% margins hold for a decade on revenue four times today’s, gets above the price. A Monte Carlo around the base case puts the probability that intrinsic value exceeds $366 at 5%. The business is excellent today; the price asks you to believe it stays this excellent, and hard-drive history says that is the one thing it has never done.
- Price · 2026-10-30$366.11-51% from the June high
- Market cap · net cash$137Bnet cash $0.4B
- EV / EBIT (TTM)23.9×EBIT $5.7B on $14.5B
- P/E FY27 · FY28 consensus17.9× · 10.2×EPS $20.5 · $35.8
- Stoxa base case$238-35% vs price
- Bear · bull$121 · $442P(value > price) 5%
- WDC close
- Bull
- Base
- Bear
Prices: Stoxa price store (Massive and Yahoo Finance, split-adjusted close). Scenario values: Stoxa valuation workbench on filings to 2026-10-30, assumptions in the scenarios section below.
Data
| Month end | Close |
|---|---|
| 2024-01 | $43.27 |
| 2024-02 | $44.95 |
| 2024-03 | $51.58 |
| 2024-04 | $53.54 |
| 2024-05 | $56.91 |
| 2024-06 | $57.27 |
| 2024-07 | $50.68 |
| 2024-08 | $49.58 |
| 2024-09 | $51.62 |
| 2024-10 | $49.37 |
| 2024-11 | $55.17 |
| 2024-12 | $45.07 |
| 2025-01 | $49.23 |
| 2025-02 | $48.93 |
| 2025-03 | $40.43 |
| 2025-04 | $43.86 |
| 2025-05 | $51.55 |
| 2025-06 | $63.99 |
| 2025-07 | $78.69 |
| 2025-08 | $80.34 |
| 2025-09 | $120.06 |
| 2025-10 | $150.21 |
| 2025-11 | $163.33 |
| 2025-12 | $172.27 |
| 2026-01 | $250.23 |
| 2026-02 | $279.70 |
| 2026-03 | $270.49 |
| 2026-04 | $434.52 |
| 2026-05 | $531.21 |
| 2026-06 | $638.72 |
| 2026-07 | $544.84 |
| 2026-08 | $450.55 |
| 2026-09 | $454.46 |
| 2026-10 | $366.11 |
What Western Digital is now
For most of the last decade Western Digital was two businesses under one roof: hard drives, and the NAND flash operation it bought with SanDisk in 2016 for $19 billion, financed with debt that peaked near $14 billion. The flash business was separated on 21 February 2025 as Sandisk Corporation (SNDK); WDC kept a stake and sold it down over the following year, using the proceeds to retire debt. What remains is the drive company: nearline (data-centre) drives are the large majority of revenue, with a tail of client and consumer drives that is shrinking as laptops move to flash.
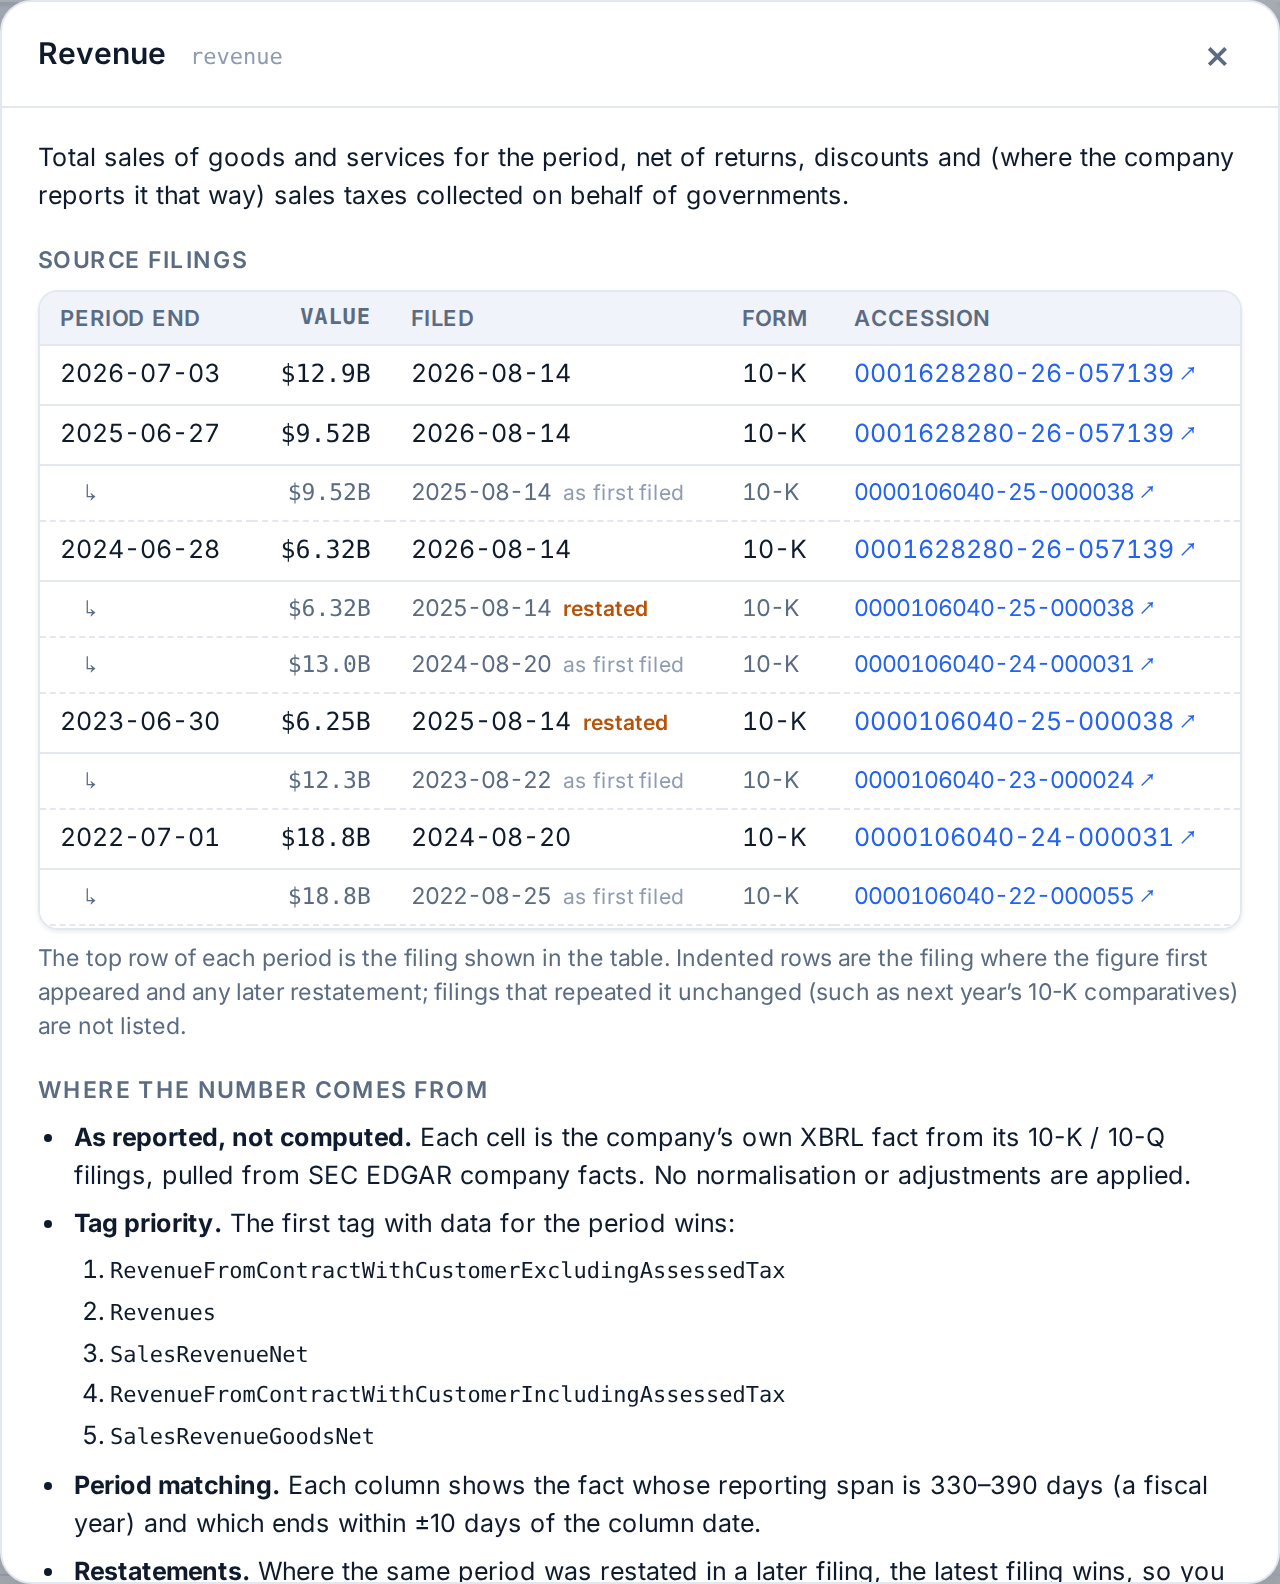
This matters for anyone opening the filings, because the comparatives were restated. Fiscal 2023 revenue was first filed as $12.3 billion and now reads $6.3 billion; fiscal 2024 went from $13.0 billion to $6.3 billion. Stoxa stores every filing of every fact, so the restatement is visible rather than silently overwritten: the provenance panel below shows the figure as first filed and as restated, with links to each 10-K. Any growth rate that spans the spin-off is comparing a two-business company with a one-business company, and we will see in a moment how that trips up a naive model.
- HDD only, as restated
- Including flash
SEC filings via Stoxa (XBRL company facts, latest filing wins). FY2026 ended 3 July 2026 and had 53 weeks.
Data
| Fiscal year | Revenue | Operating income | Scope |
|---|---|---|---|
| FY2015 | $14.57B | $1.61B | incl. Flash (pre-spin) |
| FY2016 | $12.99B | $0.47B | incl. Flash (pre-spin) |
| FY2017 | $19.09B | $1.95B | incl. Flash (pre-spin) |
| FY2018 | $20.65B | $3.62B | incl. Flash (pre-spin) |
| FY2019 | $16.57B | $0.09B | incl. Flash (pre-spin) |
| FY2020 | $16.74B | $0.34B | incl. Flash (pre-spin) |
| FY2021 | $16.92B | $1.22B | incl. Flash (pre-spin) |
| FY2022 | $18.79B | $2.39B | incl. Flash (pre-spin) |
| FY2023 | $6.25B | $-0.55B | continuing (HDD) as restated |
| FY2024 | $6.32B | $-0.40B | continuing (HDD) as restated |
| FY2025 | $9.52B | $2.33B | continuing (HDD) as restated |
| FY2026 | $12.92B | $4.45B | continuing (HDD) as restated |
- HDD only, as restated
- Including flash
SEC filings via Stoxa. Fiscal 2023 and 2024 are the restated continuing-operations figures, both loss-making.
Data
| Fiscal year | Operating margin |
|---|---|
| FY2015 | 11.1% |
| FY2016 | 3.6% |
| FY2017 | 10.2% |
| FY2018 | 17.5% |
| FY2019 | 0.5% |
| FY2020 | 2.0% |
| FY2021 | 7.2% |
| FY2022 | 12.7% |
| FY2023 | -8.8% |
| FY2024 | -6.4% |
| FY2025 | 24.5% |
| FY2026 | 34.5% |
Two things stand out. First, the drive business on its own was losing money as recently as fiscal 2024, at the bottom of the inventory correction that followed the 2022 cloud build-out. Second, the margin the company is now reporting, 34.5% for fiscal 2026 and 46.7% in the latest quarter, is roughly two and a half times anything it or Seagate has ever reported for a full year. The balance sheet, meanwhile, is transformed: long-term debt went from $5.7B at the end of fiscal 2024 to $0.92B of total debt today against $1.31B of cash, and the dividend was reinstated and then raised 17% in October.
The boom, quarter by quarter
Hard drives still hold the bulk of the world’s stored bytes because a terabyte on a nearline drive costs a fraction of a terabyte of flash. AI training and inference pipelines generate enormous volumes of data that must be kept, and hyperscalers have responded by signing multi-year agreements for capacity. Both drive makers have said they are sold out through calendar 2026. The effect on the duopoly’s numbers has been dramatic and, importantly, symmetrical: Seagate’s margin has tracked Western Digital’s almost quarter for quarter, which tells you this is an industry pricing cycle rather than one company’s execution.
- Western Digital
- Seagate
10-Q filings via Stoxa; fiscal fourth quarters derived as the 10-K year minus the three 10-Qs. Quarters labelled by calendar quarter end.
Data
| Quarter end | WDC revenue | STX revenue |
|---|---|---|
| 2023-09-29 | $1.19B | $1.45B |
| 2023-12-29 | $1.37B | $1.55B |
| 2024-03-29 | $1.75B | $1.66B |
| 2024-06-28 | $2.00B | $1.89B |
| 2024-09-27 | $2.21B | $2.17B |
| 2024-12-27 | $2.41B | $2.33B |
| 2025-03-28 | $2.29B | $2.16B |
| 2025-06-27 | $2.60B | $2.44B |
| 2025-10-03 | $2.82B | $2.63B |
| 2026-01-02 | $3.02B | $2.83B |
| 2026-04-03 | $3.34B | $3.11B |
| 2026-07-03 | $3.75B | $3.63B |
| 2026-10-02 | $4.38B | $4.23B |
- Western Digital
- Seagate
- Sector norm 17%
10-Q and 10-K filings via Stoxa. The dotted line is the 17% sector norm the workbench uses for computer hardware.
Data
| Quarter end | WDC margin | STX margin |
|---|---|---|
| 2023-09-29 | -49.9% | -8.9% |
| 2023-12-29 | -15.4% | 8.0% |
| 2024-03-29 | 5.4% | 8.6% |
| 2024-06-28 | 15.4% | 16.6% |
| 2024-09-27 | 15.1% | 18.6% |
| 2024-12-27 | 23.2% | 21.0% |
| 2025-03-28 | 33.1% | 20.0% |
| 2025-06-27 | 26.1% | 23.2% |
| 2025-10-03 | 28.1% | 26.4% |
| 2026-01-02 | 30.1% | 29.8% |
| 2026-04-03 | 35.7% | 32.1% |
| 2026-07-03 | 41.7% | 43.0% |
| 2026-10-02 | 46.7% | 48.8% |
The latest quarter in the company’s own figures. Western Digital’s fiscal year ends in late June or early July, so the quarter ended 2 October 2026 (reported 22 October) is the first quarter of fiscal 2027:
| Metric | Fiscal Q1 2027 (quarter ended 2 October 2026) | Note |
|---|---|---|
| Revenue | $4.38B, +55% y/y | guided $4.1B ± $0.1B |
| Exabytes shipped | 248 EB, +22% y/y, +8% q/q | management calls this quarter a floor for growth |
| Average price per terabyte | +28% y/y | level not disclosed; high-teens growth the quarter before |
| Cost per terabyte | −4 to −5% y/y | below the long-run 10% a year target: DRAM, NAND and supply-chain costs |
| Non-GAAP operating margin | 49.1% | GAAP 46.7% |
| Non-GAAP EPS | $4.64, +161% y/y | consensus was about $4.10 |
| Free cash flow | $1.4B | dividend raised 17% to $0.175 a quarter |
| Guidance, fiscal Q2 2027 (quarter to late December 2026) | $5.1B | gross margin 60% to 61%, EPS $5.80 ± $0.20 |
Three details from the call shape our scenarios. The price increase is partly contractual, but not all exabytes are under long-term agreements, and management described a “very strong price environment” for the uncontracted part, which is the part that will reprice first when supply catches up. Capital spending, long held at 4 to 6% of revenue, will run “modestly above” that range for the next two years for heads, media and automation, not unit capacity. And the technology transition is real but late relative to Seagate: WDC’s ePMR platform is expected to be about half of nearline shipments by the March quarter, while its heat-assisted (HAMR) drives ship in the first half of calendar 2027, a product Seagate has been shipping at hyperscale for over a year.
What the workbench says before we touch anything
We start every analysis the same way: open the company in Stoxa and read what the default model says, then read why it says it. The defaults are Damodaran-style base-case rules applied mechanically to the filings, and the point of them is not to be right, it is to be transparent, so that every departure is a decision you can see.
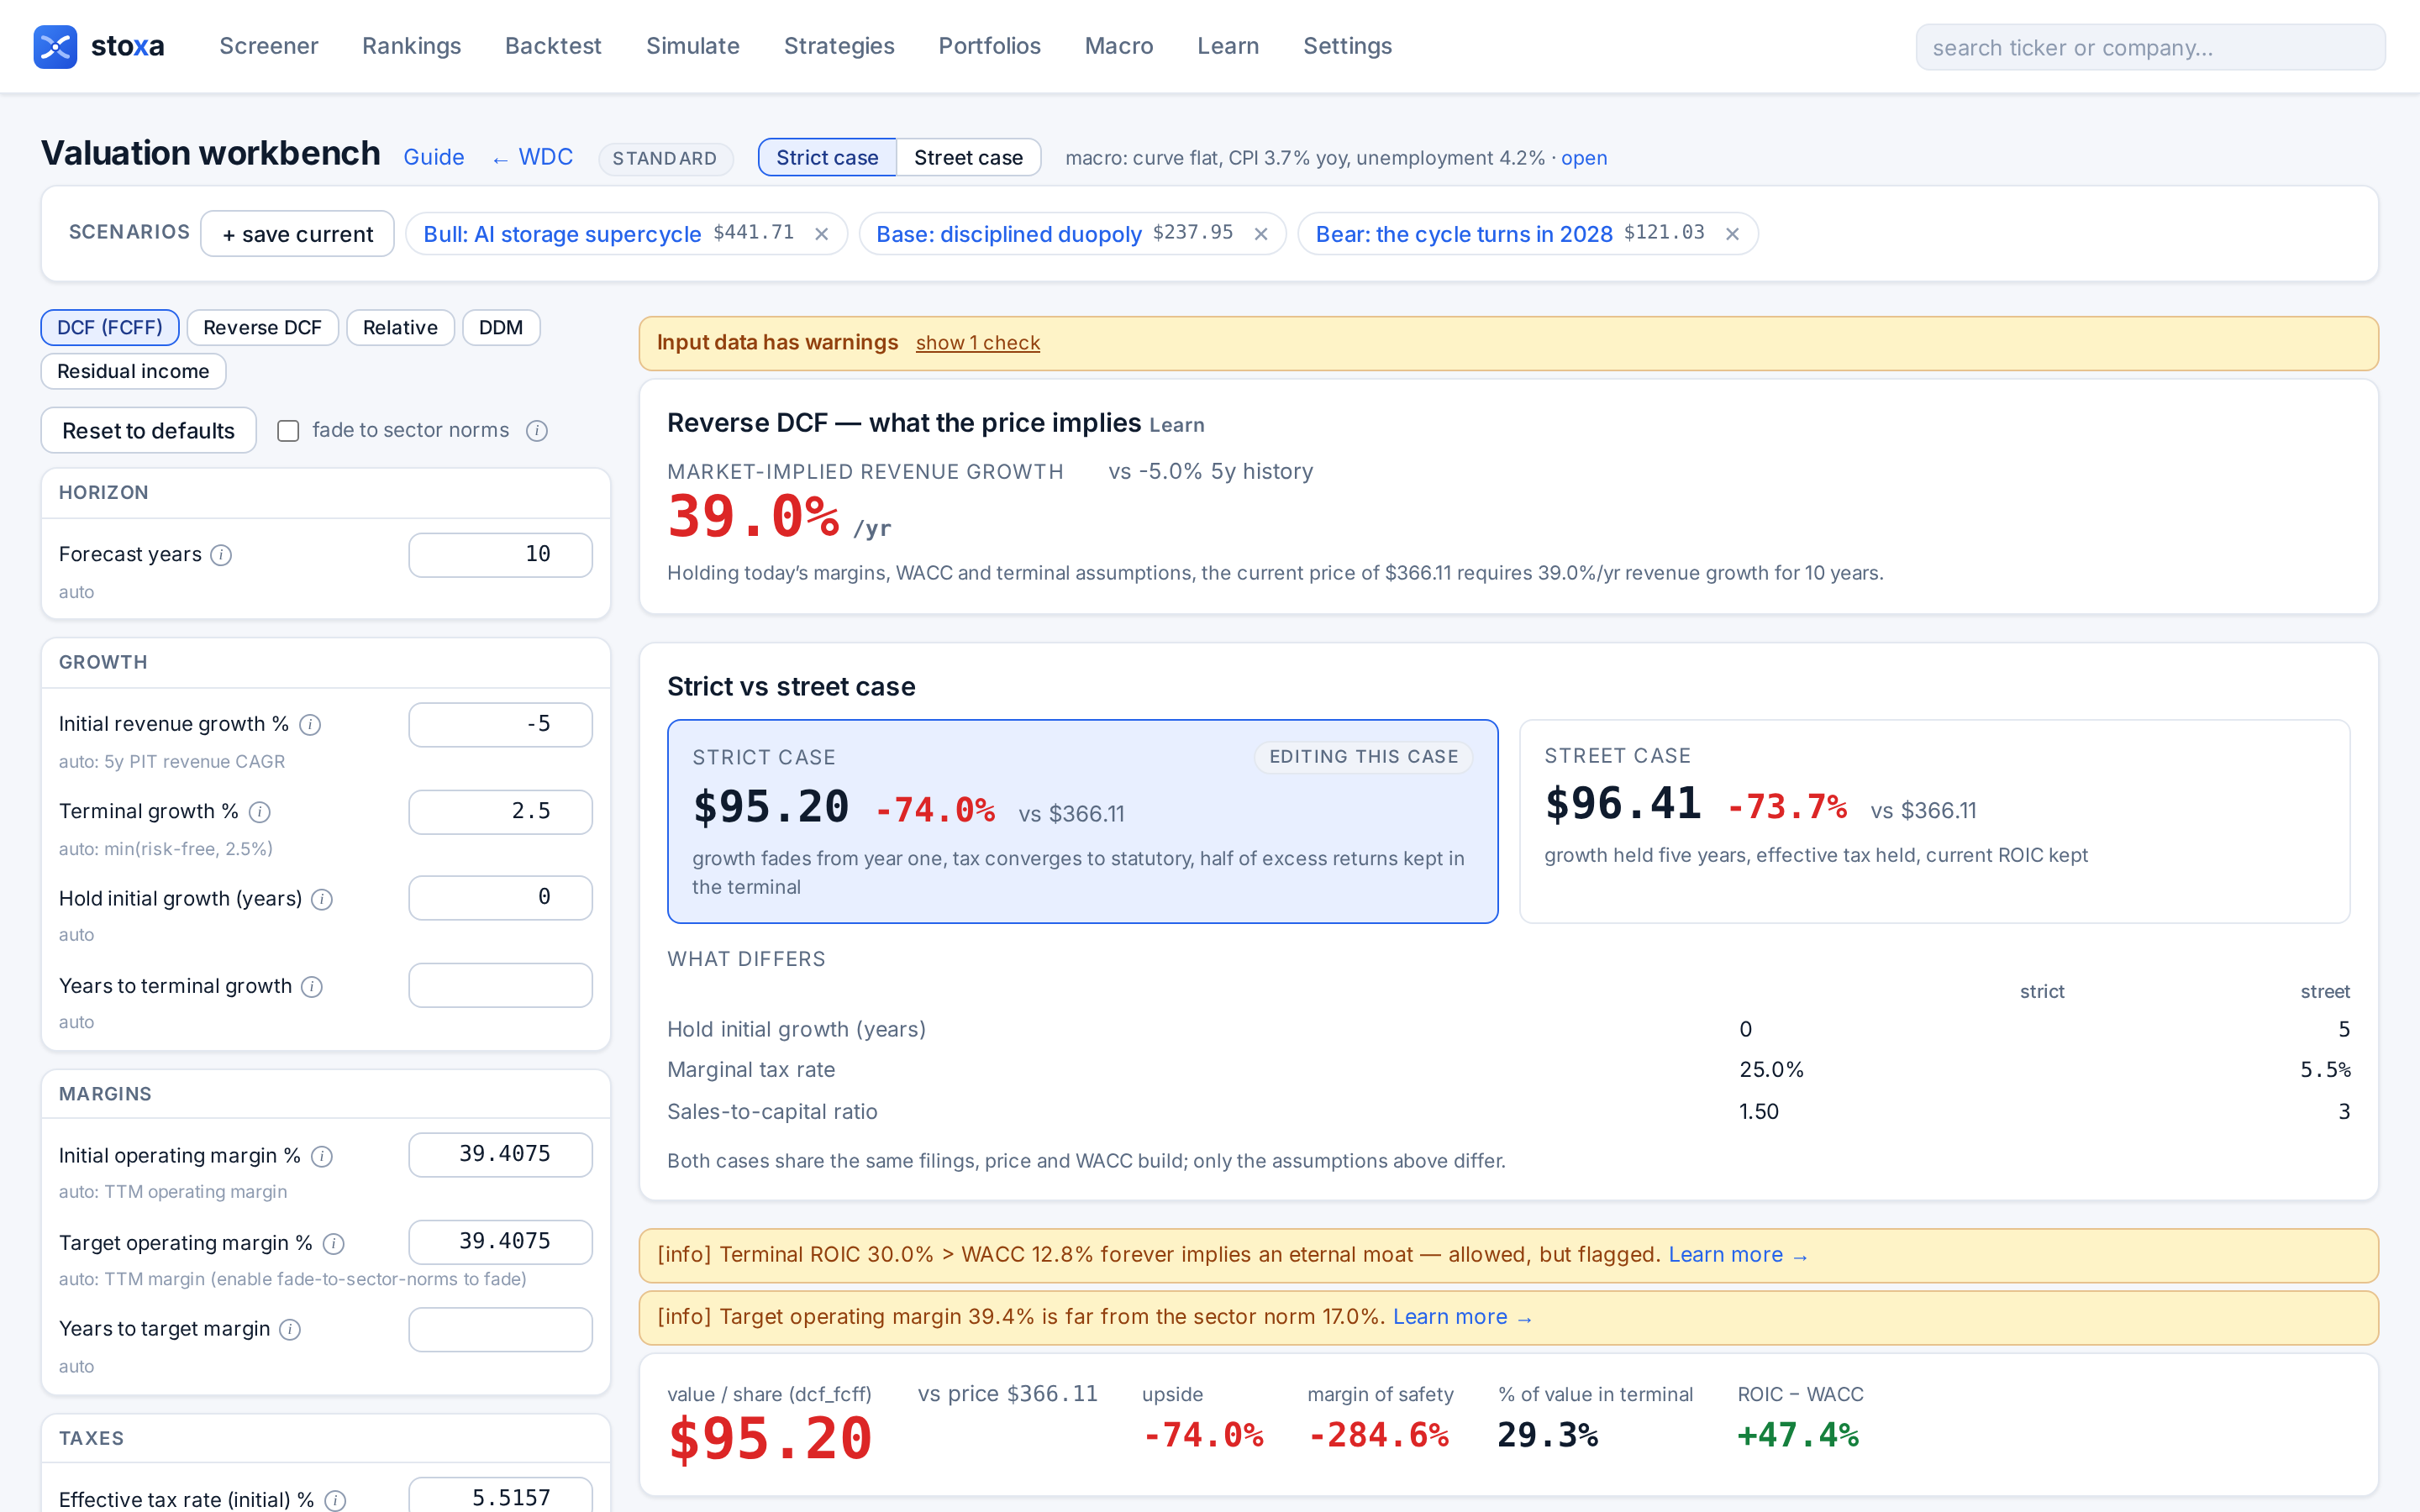
The first thing the workbench does is check the inputs. It flags that trailing net income of $10.0B is 1.8 times operating profit of $5.7B, which for a company with almost no interest income means a large non-operating gain: here the mark-to-market and sale gains on the retained Sandisk shares, plus a tax benefit. Any valuation keyed off net income or the trailing P/E of 13.7× is therefore wrong by construction; the DCF keys off operating profit and is not affected, but the check is a useful reminder to work from EBIT.

Then it values the company. Both presets land in the same place, about $95 a share for the strict case and $96 for the street case, roughly 74% below the price. The reverse DCF reports that, holding the default margins and discount rate, the price requires 39.0% a year revenue growth for ten years. Read naively, that would be a screaming sell. Read properly, it is four default assumptions that this particular company breaks, and the workbench labels each of them with its source so we can see which:
| Default | Value | Where it comes from | Why it misleads here |
|---|---|---|---|
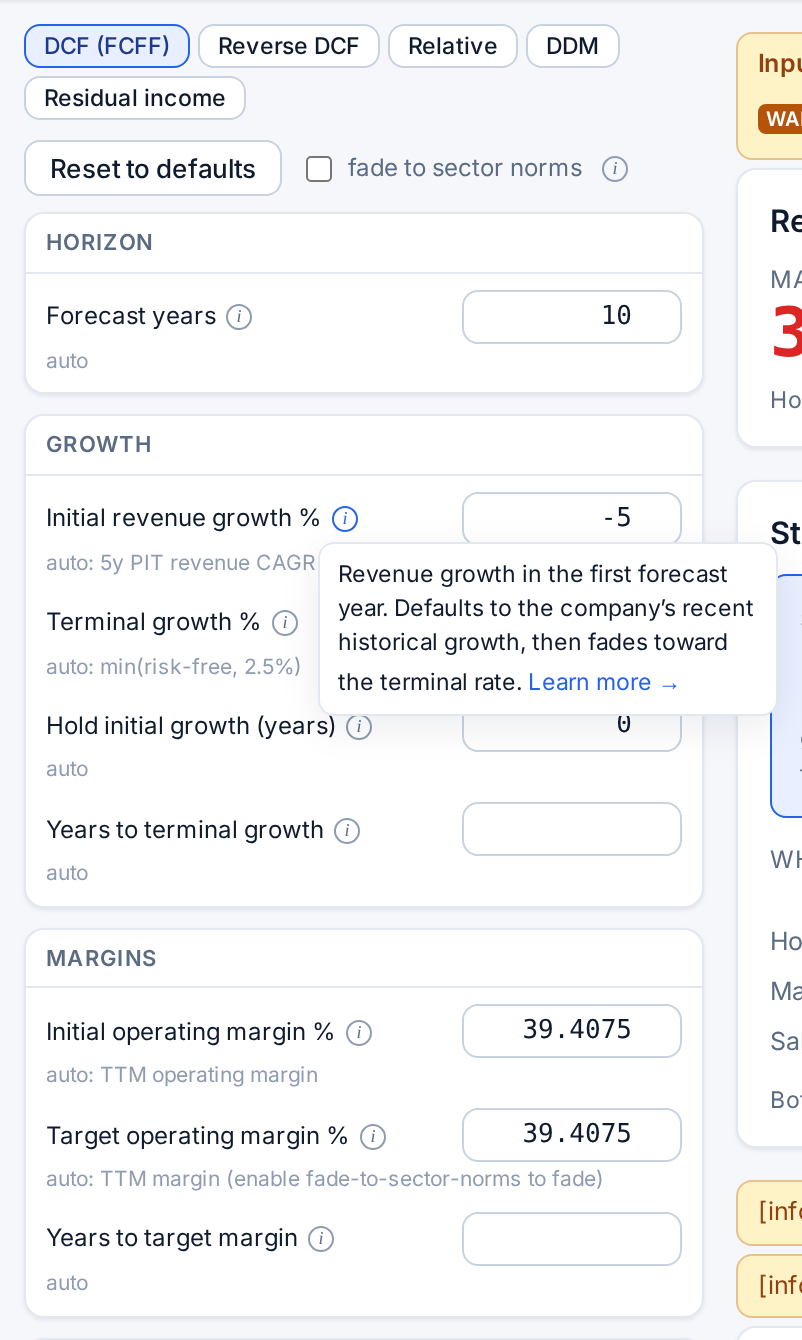
| Initial revenue growth | -5% | five-year point-in-time revenue CAGR, floor −5% | the five-year window starts with flash revenue included and ends without it; the restated HDD business grew 36% last year and 55% last quarter |
| Beta | 1.82 | weekly regression against SPY over three years, Blume-smoothed | a stock that rose eightfold and then halved in eighteen months has an enormous regression beta; with the 10-year Treasury at 4.98% this gives a 12.8% cost of capital. The bottom-up sector beta is 1.21, for a WACC of 10.2% |
| Operating margin | 39.4% | trailing twelve months, held flat (SIC 3572 is not on the cyclical list, so no mid-cycle averaging) | the trailing figure is below the current run-rate of 47 to 50%, but it is also two and a half times the best full year in the industry’s history, and it is held forever |
| Sales-to-capital | 1.5 | sector norm, because revenue shrank over the window | WDC grew revenue by $6.6B over two years on about $0.8B of capex; the measured ratio is far higher. A low ratio makes growth expensive and understates value |
| Terminal ROIC | 30% | half of the current ROIC–WACC spread retained, capped at 30% | reasonable mechanically, but current ROIC of 60% is a peak-cycle figure on a written-down asset base |
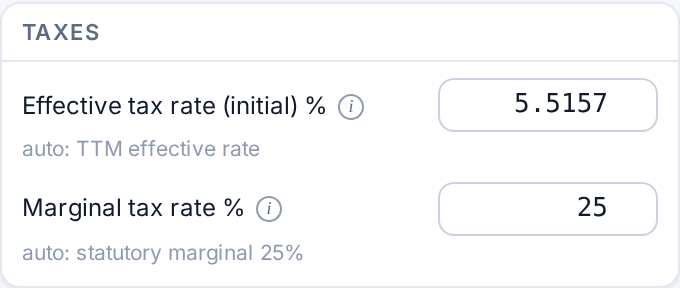
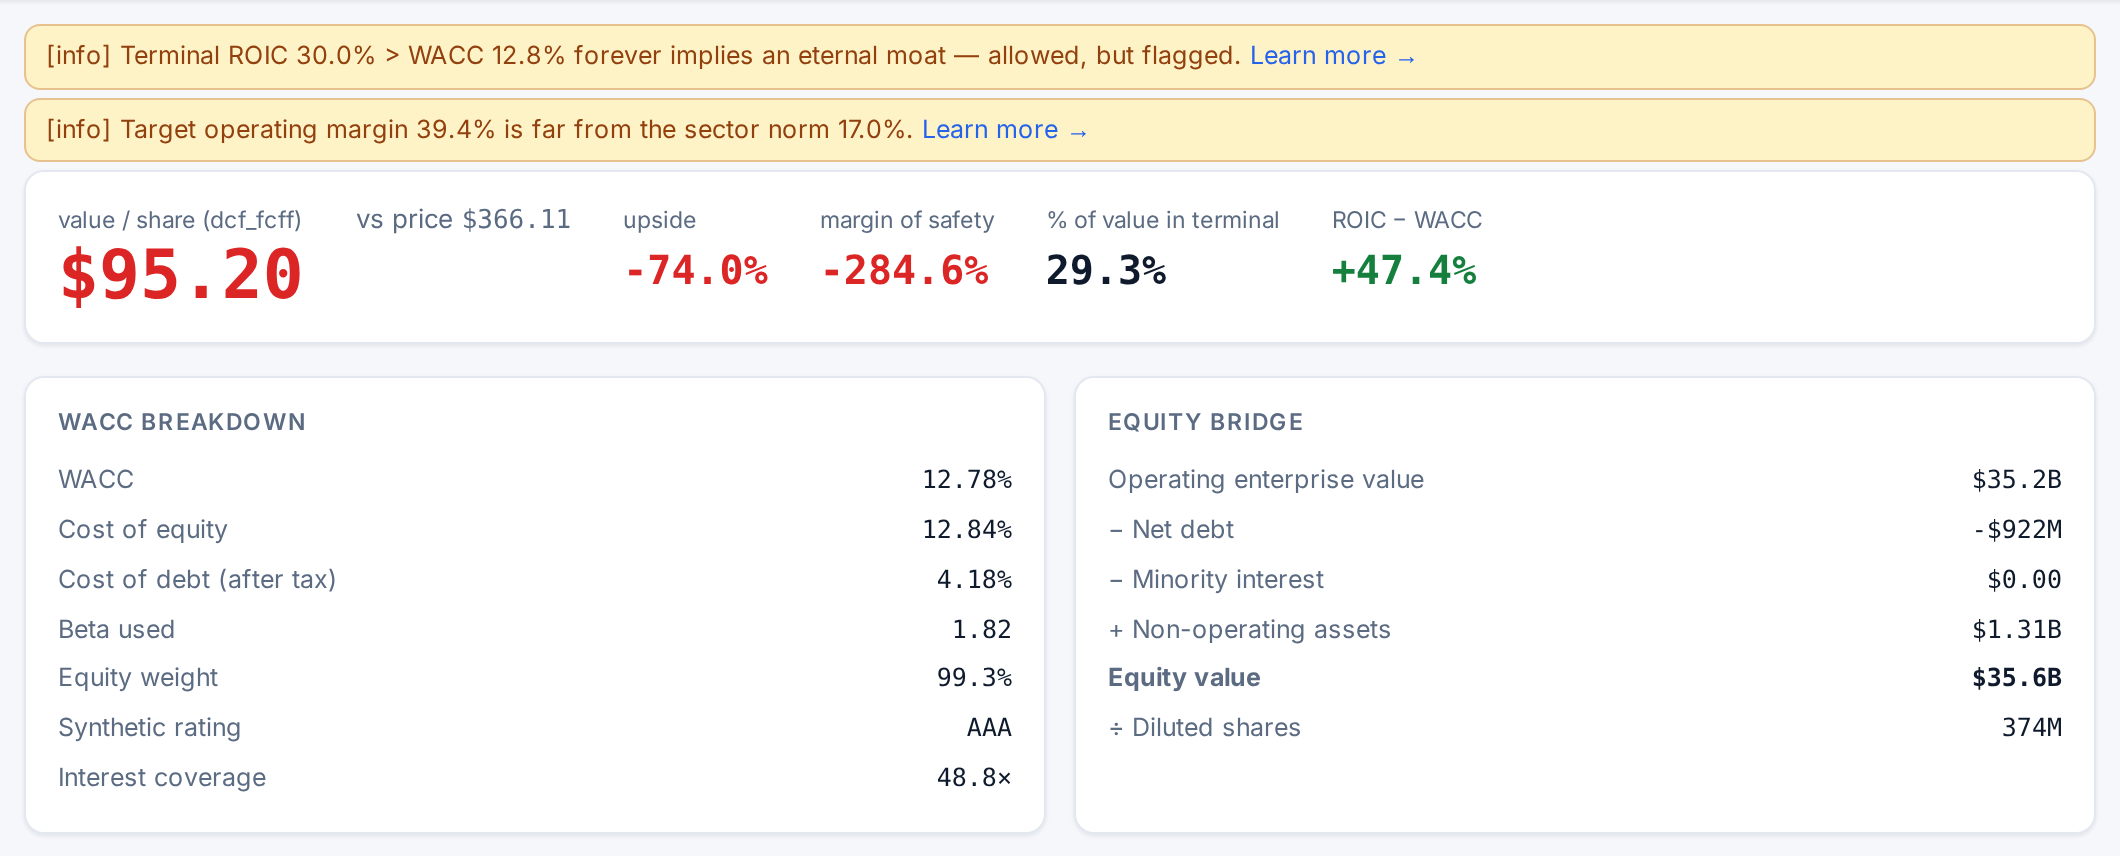
One default we keep as it is: the 2.5% terminal growth rate, capped by the risk-free rate, and the statutory 25% marginal tax rate that the effective rate converges to. WDC’s effective tax rate was 5.5% over the trailing year thanks to loss carry-forwards; we start at 10% and let the model converge, which is a drag on our values relative to a street model that holds the low rate.
Three scenarios we can defend
All three scenarios share the same discount rate (10.16%, from the bottom-up beta of 1.21 and a 4.98% risk-free rate), the same starting operating margin of 48% (the fiscal 2027 run-rate implied by the December-quarter guidance), the same tax path, and the workbench’s rule that growth has to be paid for with reinvestment. They differ in how long the boom lasts, where the margin settles, and whether the company keeps earning more than its cost of capital in the terminal period.
| Bear: the cycle turns in 2028 | Base: disciplined duopoly | Bull: AI storage supercycle | |
|---|---|---|---|
| The story | Hyperscalers digest in 2028 as HAMR adds supply; pricing gives back the 2026 gains; margins fall back to a level still above any prior cycle | Sold out through 2027; growth fades to 2.5% by year six; the duopoly keeps pricing discipline and settles at 30% | Exabyte growth above 25% for most of the decade; long-term agreements with price floors; 42% margins hold |
| Revenue growth | 30% in year one, fading to 2.5% by year three | 32% in year one, fading to 2.5% by year six | 35% held one year, fading to 2.5% by year seven |
| Operating margin | 48% to 20% by year five | 48% to 30% by year six | 48% to 42% by year ten |
| Sales-to-capital | 2.0 | 2.0 | 2.5 |
| Terminal ROIC | equal to WACC (no excess return) | 20% | 30% |
| Year-10 revenue | $26.7B | $40.6B | $57.5B |
| Year-10 operating income | $5.3B | $12.2B | $24.1B |
| Share of value in the terminal | 34% | 46% | 51% |
| Value per share | $121 | $238 | $442 |
| Against the price | -67% | -35% | +21% |
- Bull
- Base
- Bear
Stoxa valuation runs; year 1 is approximately fiscal 2027. Street consensus: fiscal 2027 $19.4B, fiscal 2028 $26.9B.
Data
| Year | Bear | Base | Bull |
|---|---|---|---|
| 1 | $18.8B | $19.1B | $19.6B |
| 2 | $21.9B | $24.1B | $26.4B |
| 3 | $22.4B | $29.0B | $33.9B |
| 4 | $23.0B | $33.1B | $41.4B |
| 5 | $23.6B | $35.9B | $47.8B |
| 6 | $24.2B | $36.8B | $52.1B |
| 7 | $24.8B | $37.7B | $53.4B |
| 8 | $25.4B | $38.7B | $54.7B |
| 9 | $26.0B | $39.6B | $56.1B |
| 10 | $26.7B | $40.6B | $57.5B |
- Bull
- Base
- Bear
Stoxa valuation runs. For reference, the best full-year margin before 2025 was 17.5% (WDC, fiscal 2018) and 16.8% (Seagate, fiscal 2022).
Data
| Year | Bear | Base | Bull |
|---|---|---|---|
| 1 | 48.0% | 48.0% | 48.0% |
| 2 | 41.0% | 44.4% | 47.3% |
| 3 | 34.0% | 40.8% | 46.7% |
| 4 | 27.0% | 37.2% | 46.0% |
| 5 | 20.0% | 33.6% | 45.3% |
| 6 | 20.0% | 30.0% | 44.7% |
| 7 | 20.0% | 30.0% | 44.0% |
| 8 | 20.0% | 30.0% | 43.3% |
| 9 | 20.0% | 30.0% | 42.7% |
| 10 | 20.0% | 30.0% | 42.0% |
The base case is not a pessimistic one. It has revenue almost tripling to $41B by year ten, operating income of $12.2B against $5.7B today, a 30% margin that is nearly double the best year the industry had before 2025, and a 20% return on capital in perpetuity, which the workbench flags as an “eternal moat” because it exceeds the cost of capital forever. We think that is a fair description of a two-player industry with high switching costs on qualified drives. It is worth $238 a share.
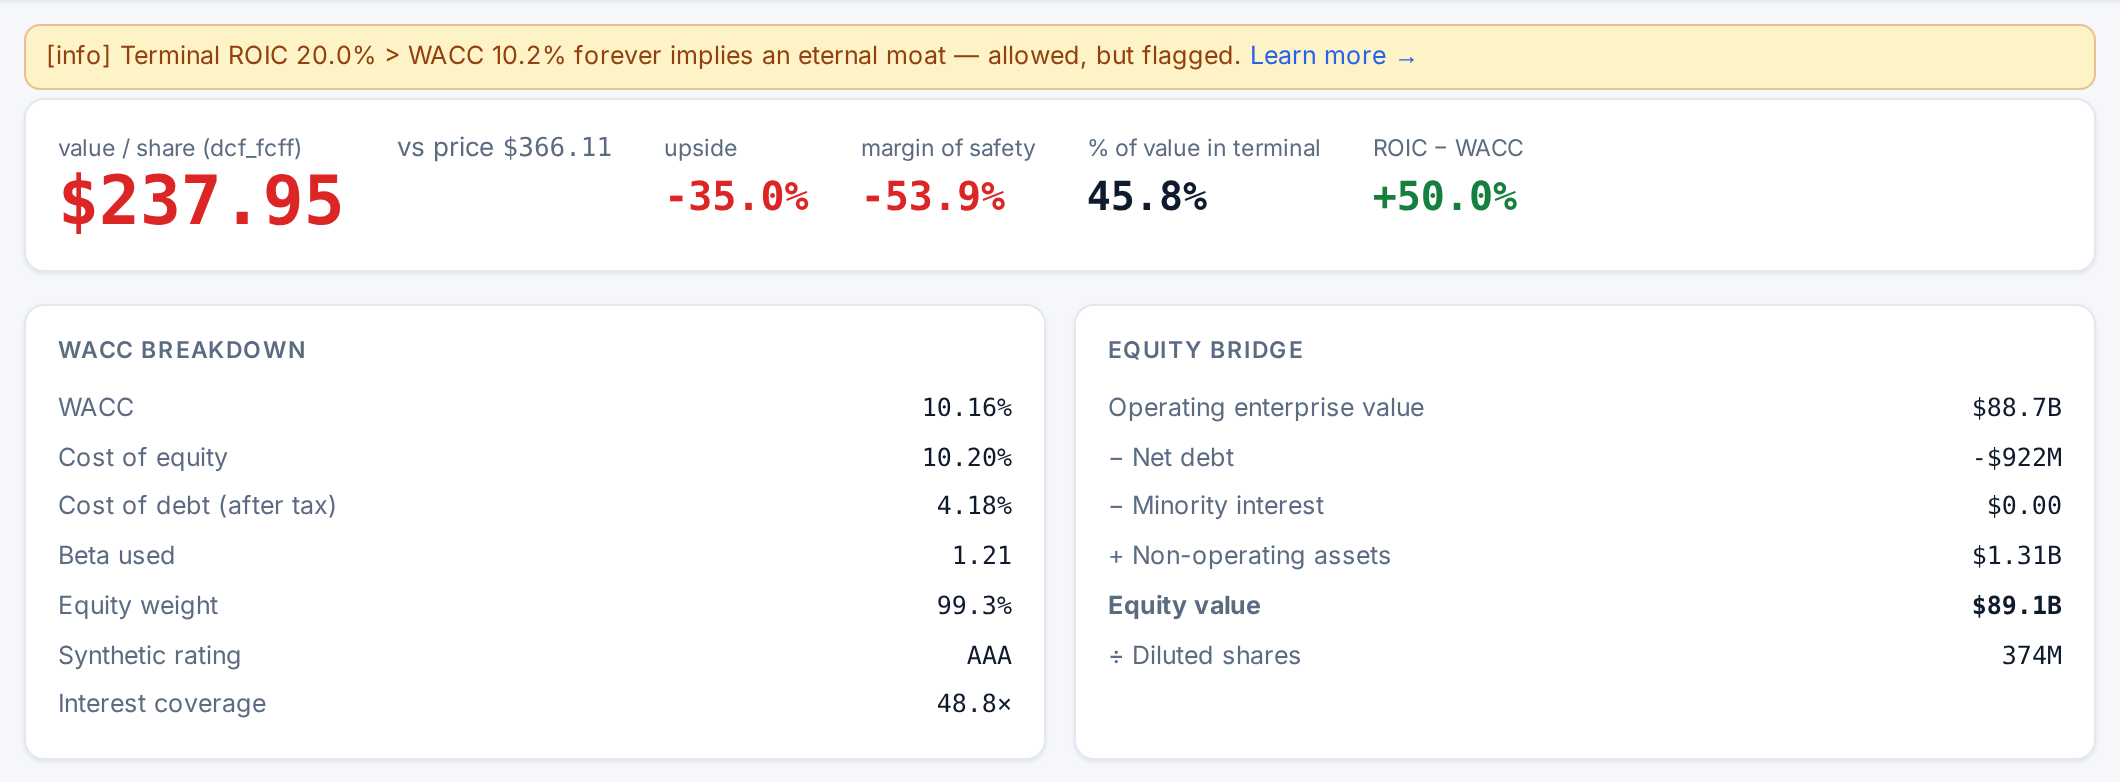
The bear case deserves a word, because it is the one the industry’s history argues for and the market has stopped considering. Hard-drive demand has had an inventory correction roughly every three to four years (2012, 2016, 2019, 2022 to 2023), each time taking margins from the high teens to zero or below. Our bear case does not even go that far: margins settle at 20%, above every prior cycle’s peak, and revenue never falls. It is still worth only $121. The bull case requires 42% margins to survive the HAMR transition, hyperscaler negotiating power and ten years of competition from a Seagate that is currently ahead on technology, on revenue four times today’s. It is worth $442, 21% above the price. Note that the gap between scenarios is driven far more by margin than by growth: in the workbench’s structure, growth has to be bought with reinvestment, so a point of margin is worth more than a point of growth.

What you have to believe at $366
The reverse DCF is the most useful single tool here. Holding our base-case margin path and discount rate, the workbench solves for the starting growth rate that makes the model equal the price: it is 54.5% a year, fading to 2.5% by year six, which puts year-ten revenue well above $60B. On the bull-case margin path the price needs 28.2%. So $366 is consistent with either very rapid growth at a normalising margin, or bull-case margins at roughly the growth the company is guiding to for this year. Both are possible; neither is a base case.

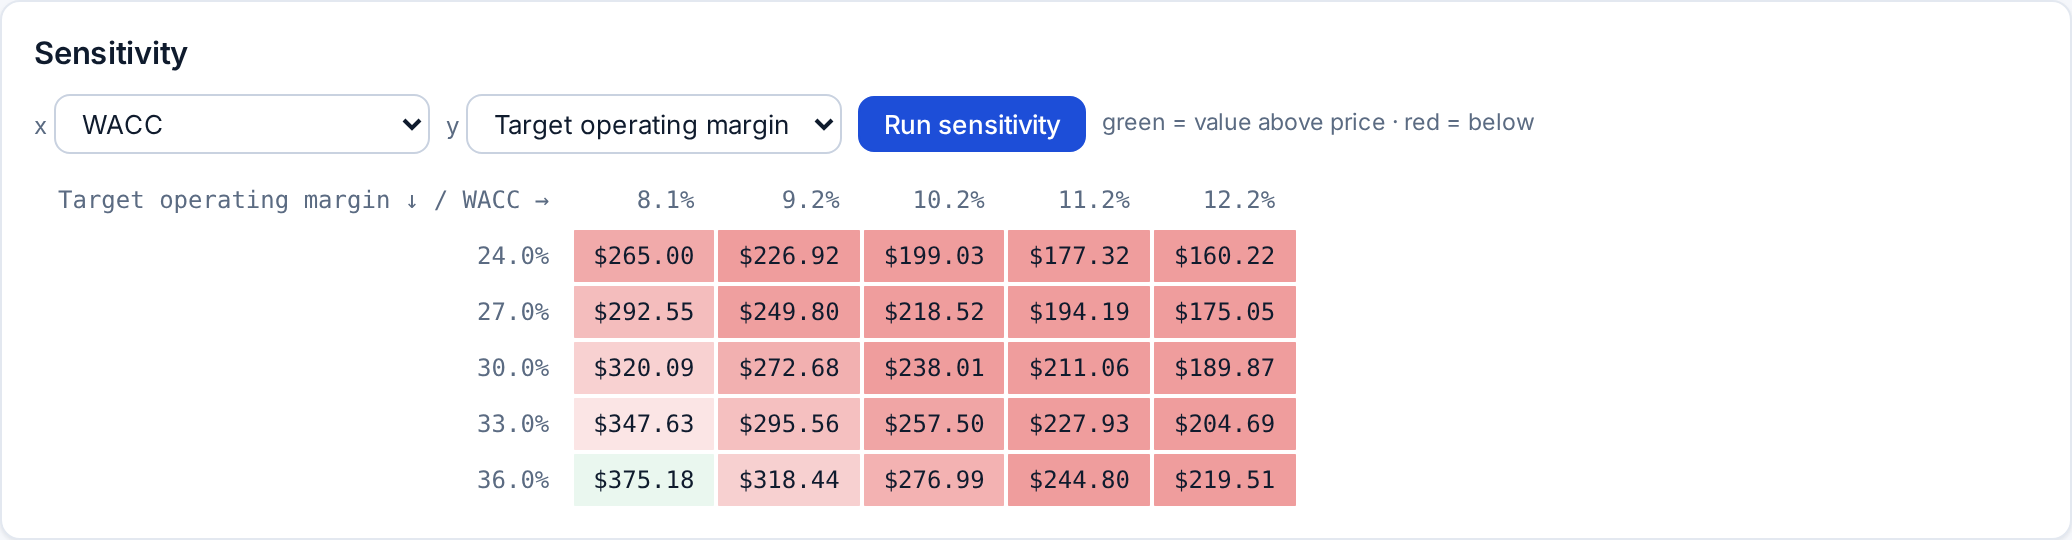
A second way to see it is through the sensitivity grid: value against the terminal operating margin and the discount rate, with everything else at the base case. At a 10% discount rate no margin in the grid reaches the price, 45% included; at 9% it takes a 45% margin. At a 10% discount rate, a 40% margin held forever is worth $309; you need to drop the discount rate to 8% and hold a 35% margin to reach $374.
| Terminal operating margin ↓ / WACC → | 8% | 9% | 10% | 11% | 12% |
|---|---|---|---|---|---|
| 20% | $233 | $200 | $176 | $158 | $143 |
| 25% | $280 | $240 | $210 | $187 | $168 |
| 30% | $327 | $279 | $243 | $215 | $194 |
| 35% | $374 | $318 | $276 | $244 | $219 |
| 40% | $422 | $357 | $309 | $273 | $244 |
| 45% | $469 | $396 | $343 | $302 | $269 |
Stoxa sensitivity endpoint on the base scenario, 30 engine runs. The workbench’s own grid is shown in the screenshot below.
| Terminal operating margin ↓ / Initial revenue growth → | 15% | 25% | 32% | 40% | 50% |
|---|---|---|---|---|---|
| 20% | $126 | $152 | $173 | $200 | $239 |
| 25% | $147 | $179 | $205 | $239 | $288 |
| 30% | $169 | $207 | $238 | $278 | $336 |
| 35% | $190 | $234 | $270 | $317 | $385 |
| 40% | $211 | $262 | $303 | $356 | $434 |
| 45% | $232 | $289 | $335 | $396 | $483 |
Stoxa sensitivity endpoint on the base scenario. A 50% starting growth rate on this fade puts year-ten revenue near $62B.
Monte Carlo: how wide is the range
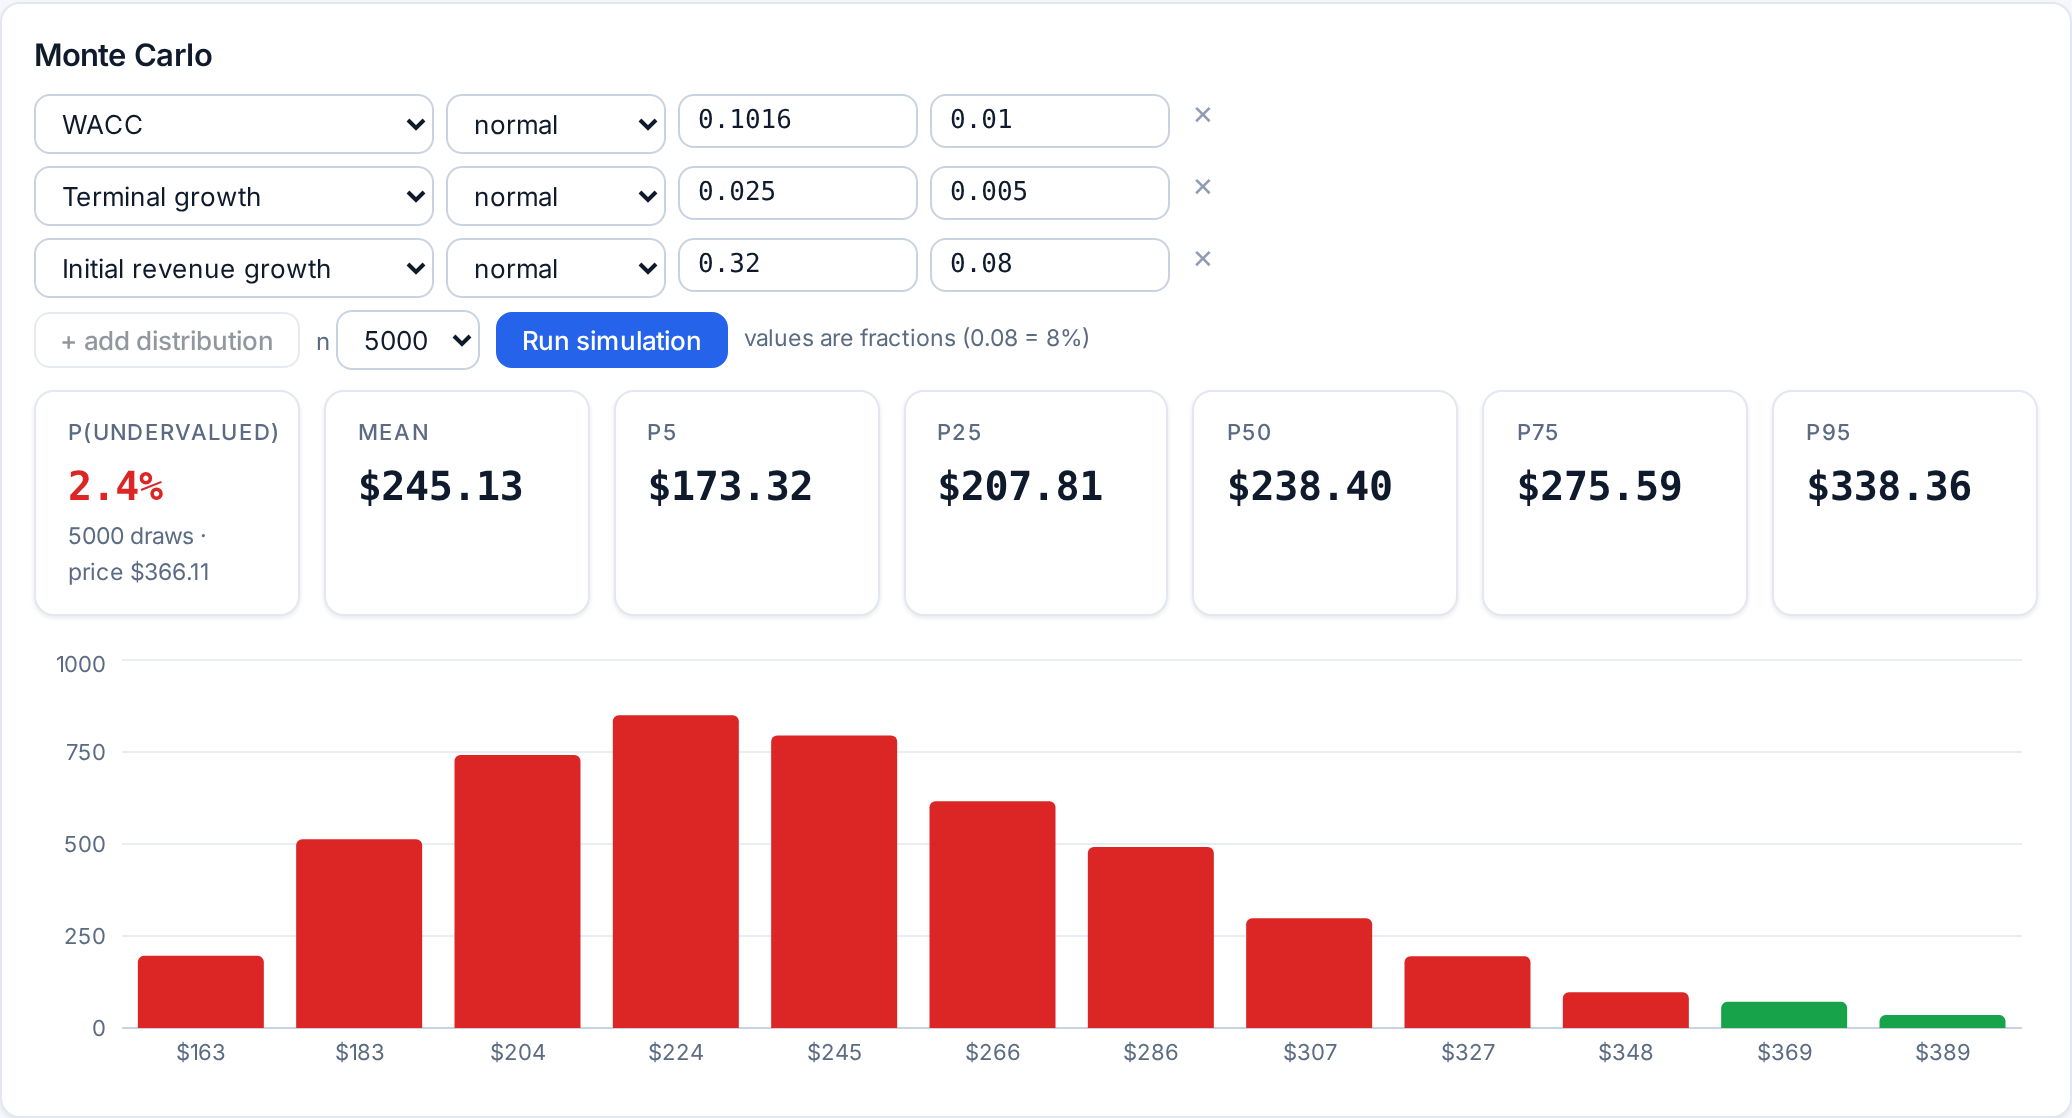
A point estimate hides how uncertain each input is, so we drew 20,000 valuations around the base case: starting growth normally distributed around 32% with an 8-point standard deviation, the terminal margin triangular between 18% and 44% with a mode of 30%, the discount rate normal around 10.2% with a one-point standard deviation, and terminal growth normal around 2.5% with a half-point standard deviation. The margin distribution is deliberately wide: it spans our bear and bull cases.
Stoxa Monte Carlo endpoint on the base scenario. Mean $250, median $241, 5th to 95th percentile $162 to $366; share of draws above the price 5.0%.
Data
| From | To | Share of draws |
|---|---|---|
| $137 | $162 | 4.1% |
| $162 | $187 | 9.6% |
| $187 | $211 | 15.3% |
| $211 | $236 | 16.4% |
| $236 | $261 | 15.4% |
| $261 | $286 | 12.9% |
| $286 | $311 | 9.2% |
| $311 | $335 | 6.3% |
| $335 | $360 | 4.0% |
| $360 | $385 | 2.4% |
| $385 | $410 | 1.4% |
| $410 | $435 | 0.9% |
The 95th percentile of the simulation is $366, essentially the price. That is the honest summary of this analysis: the current price is a one-in-twenty outcome for a company whose long-run margin lands somewhere between the bear and bull cases with the base case most likely. The screenshot below is the same simulation run inside the workbench with its three-input form; the shape is the same.
Cross-checks: multiples and Seagate
The workbench’s relative model picks peers by size and sector, which for a $137 billion company means a list of industrials and large-cap technology names (Eaton, Deere, Caterpillar, IBM) alongside Seagate; its implied values range from $168 on EV/sales to $707 on the distorted P/E. We put more weight on a hand-picked set: the other half of the duopoly, a storage-systems company, and the memory maker that is riding the same AI build-out.
| WDC | STX | NTAP | MU | |
|---|---|---|---|---|
| Price | $366.11 | $644.58 | $199.18 | $884.74 |
| Market cap | $137B | $148B | $39B | $1001B |
| Revenue, TTM | $14.5B | $13.8B | $7.4B | $133B |
| Revenue growth, TTM | +43% | +44% | +12% | +256% |
| Operating margin, TTM | 39.4% | 39.6% | 25.0% | 74.6% |
| EV / EBIT | 23.9× | 27.3× | 20.7× | 9.7× |
| EV / EBITDA | 22.4× | 26.0× | 18.9× | 8.9× |
| EV / sales | 9.4× | 10.7× | 5.3× | 7.5× |
| P/E, trailing | 13.7× (gains) | 33.7× | 27.6× | 11.8× |
| Return on invested capital | 60% | 98% | 220% | 81% |
Seagate is the cleanest comparison and it is more expensive on every operating multiple: 27.3× trailing EBIT against WDC’s 23.9×, with the same revenue, the same margin and a technology lead. On that basis WDC is the cheaper way to own the duopoly, and if you believe the supercycle you should prefer it. But “cheaper than Seagate” is a relative statement; both prices embed the same assumption about permanence, and the DCF above says what that assumption costs. WDC’s own five-year median EV/EBITDA, for what it is worth, is 11.0×; the stock trades at twice that on peak earnings.
Stoxa valuation runs for the DCF rows; Monte Carlo 5th to 95th percentile; relative valuation from the workbench’s peer multiples (EV/EBITDA and EV/sales); sell-side targets as reported after the October 2026 results (TD Cowen $430 to Melius $1,050, average about $584).
What would make us wrong
Upside risks to our base case. The long-term agreements may contain price floors that make the 2026 pricing structurally stickier than any prior cycle; management has said new agreements are replacing expiring ones at good terms. Exabyte growth could run well above 25% for years if inference workloads keep generating data that has to be retained. The HAMR ramp could close the technology gap with Seagate on schedule, which would protect share in 2027 and 2028. Capital returns could accelerate: with no debt and $1.4 billion of quarterly free cash flow, a large buyback at these prices would be accretive to our per-share values. And the duopoly itself is a genuine change from the five-player industry that produced the historical margin record; it may simply behave better.
Downside risks. Hyperscaler capital spending is the single variable everything else depends on, and it has never grown in a straight line. The cost-per-terabyte decline has slowed to 4 to 5% a year because of DRAM and NAND input costs; if pricing normalises before costs do, margins compress from both sides. High-capacity flash (QLC) is being pitched at the warm tier of nearline storage and every point of share it takes is a point of growth WDC does not get. Customer concentration is extreme by construction. The trailing effective tax rate of 5.5% will rise as loss carry-forwards are used. And the stock itself, with an 80% annualised volatility and a regression beta near 2, will move far more than the business does in either direction.
Method and how to reproduce this
Every number above comes from the Stoxa API on the data as of 2026-10-30: company fundamentals from SEC EDGAR company facts with the filing provenance shown earlier, prices from the nightly price store, the 10-year Treasury yield from the macro store, Damodaran’s equity risk premium and sector data as bundled with the workbench, and the valuation engine for every run. The one pure engine executes the point estimates, the reverse DCF, the sensitivity grids and the Monte Carlo, so they cannot disagree with each other. Street figures (consensus estimates, price targets, the quarter’s exabytes and pricing) are from the company’s release and call and from published estimate summaries, and are marked as such.
To reproduce the base case, open WDC in the workbench, switch beta to bottom-up, set initial revenue growth to 32% with six years to terminal growth, initial operating margin 48% and target 30% with six years to target, effective tax 10%, sales-to-capital 2.0 and terminal ROIC 20%, then save it as a scenario. Or run it from Python with the Stoxa SDK:
from stoxa import equities

a = equities.default_assumptions("WDC")
a.wacc.beta_method = "bottom_up"
a.revenue_growth.initial, a.revenue_growth.fade_years = 0.32, 6
a.operating_margin.initial, a.operating_margin.target = 0.48, 0.30
a.operating_margin.fade_years = 6
a.tax_rate.initial, a.tax_rate.marginal = 0.10, 0.25
a.reinvestment.sales_to_capital = 2.0
a.terminal.roic = 0.20
r = equities.value_company("WDC", assumptions=a)
print(r.value_per_share, r.upside)          # 237.95, -0.350
The theory behind each step is in Learn: the reverse DCF, the cost of capital, terminal value and the growth-reinvestment link, and sensitivity and Monte Carlo.
This analysis is for information and education. It is not investment advice, a recommendation, or an offer to buy or sell any security, and it may be wrong. The authors hold no position in Western Digital or Seagate at publication. Figures are as of the dates stated and will change; the workbench will show different defaults as new filings and prices arrive.