
Summary
Palantir reported its third quarter on 2 November 2026 and the numbers were, by any ordinary standard, extraordinary: revenue of $2.31B, up 96% on a year earlier, a GAAP operating margin of 47%, US commercial revenue up 148%, net dollar retention of 165%, and full-year guidance raised to $8.53B, which is 91% growth for a company that made $4.5B last year. The stock fell anyway, 8% before the open and 1.6% by the close, because total contract value booked grew only 6% and the market has learned to read Palantir’s bookings as the leading indicator of its revenue.
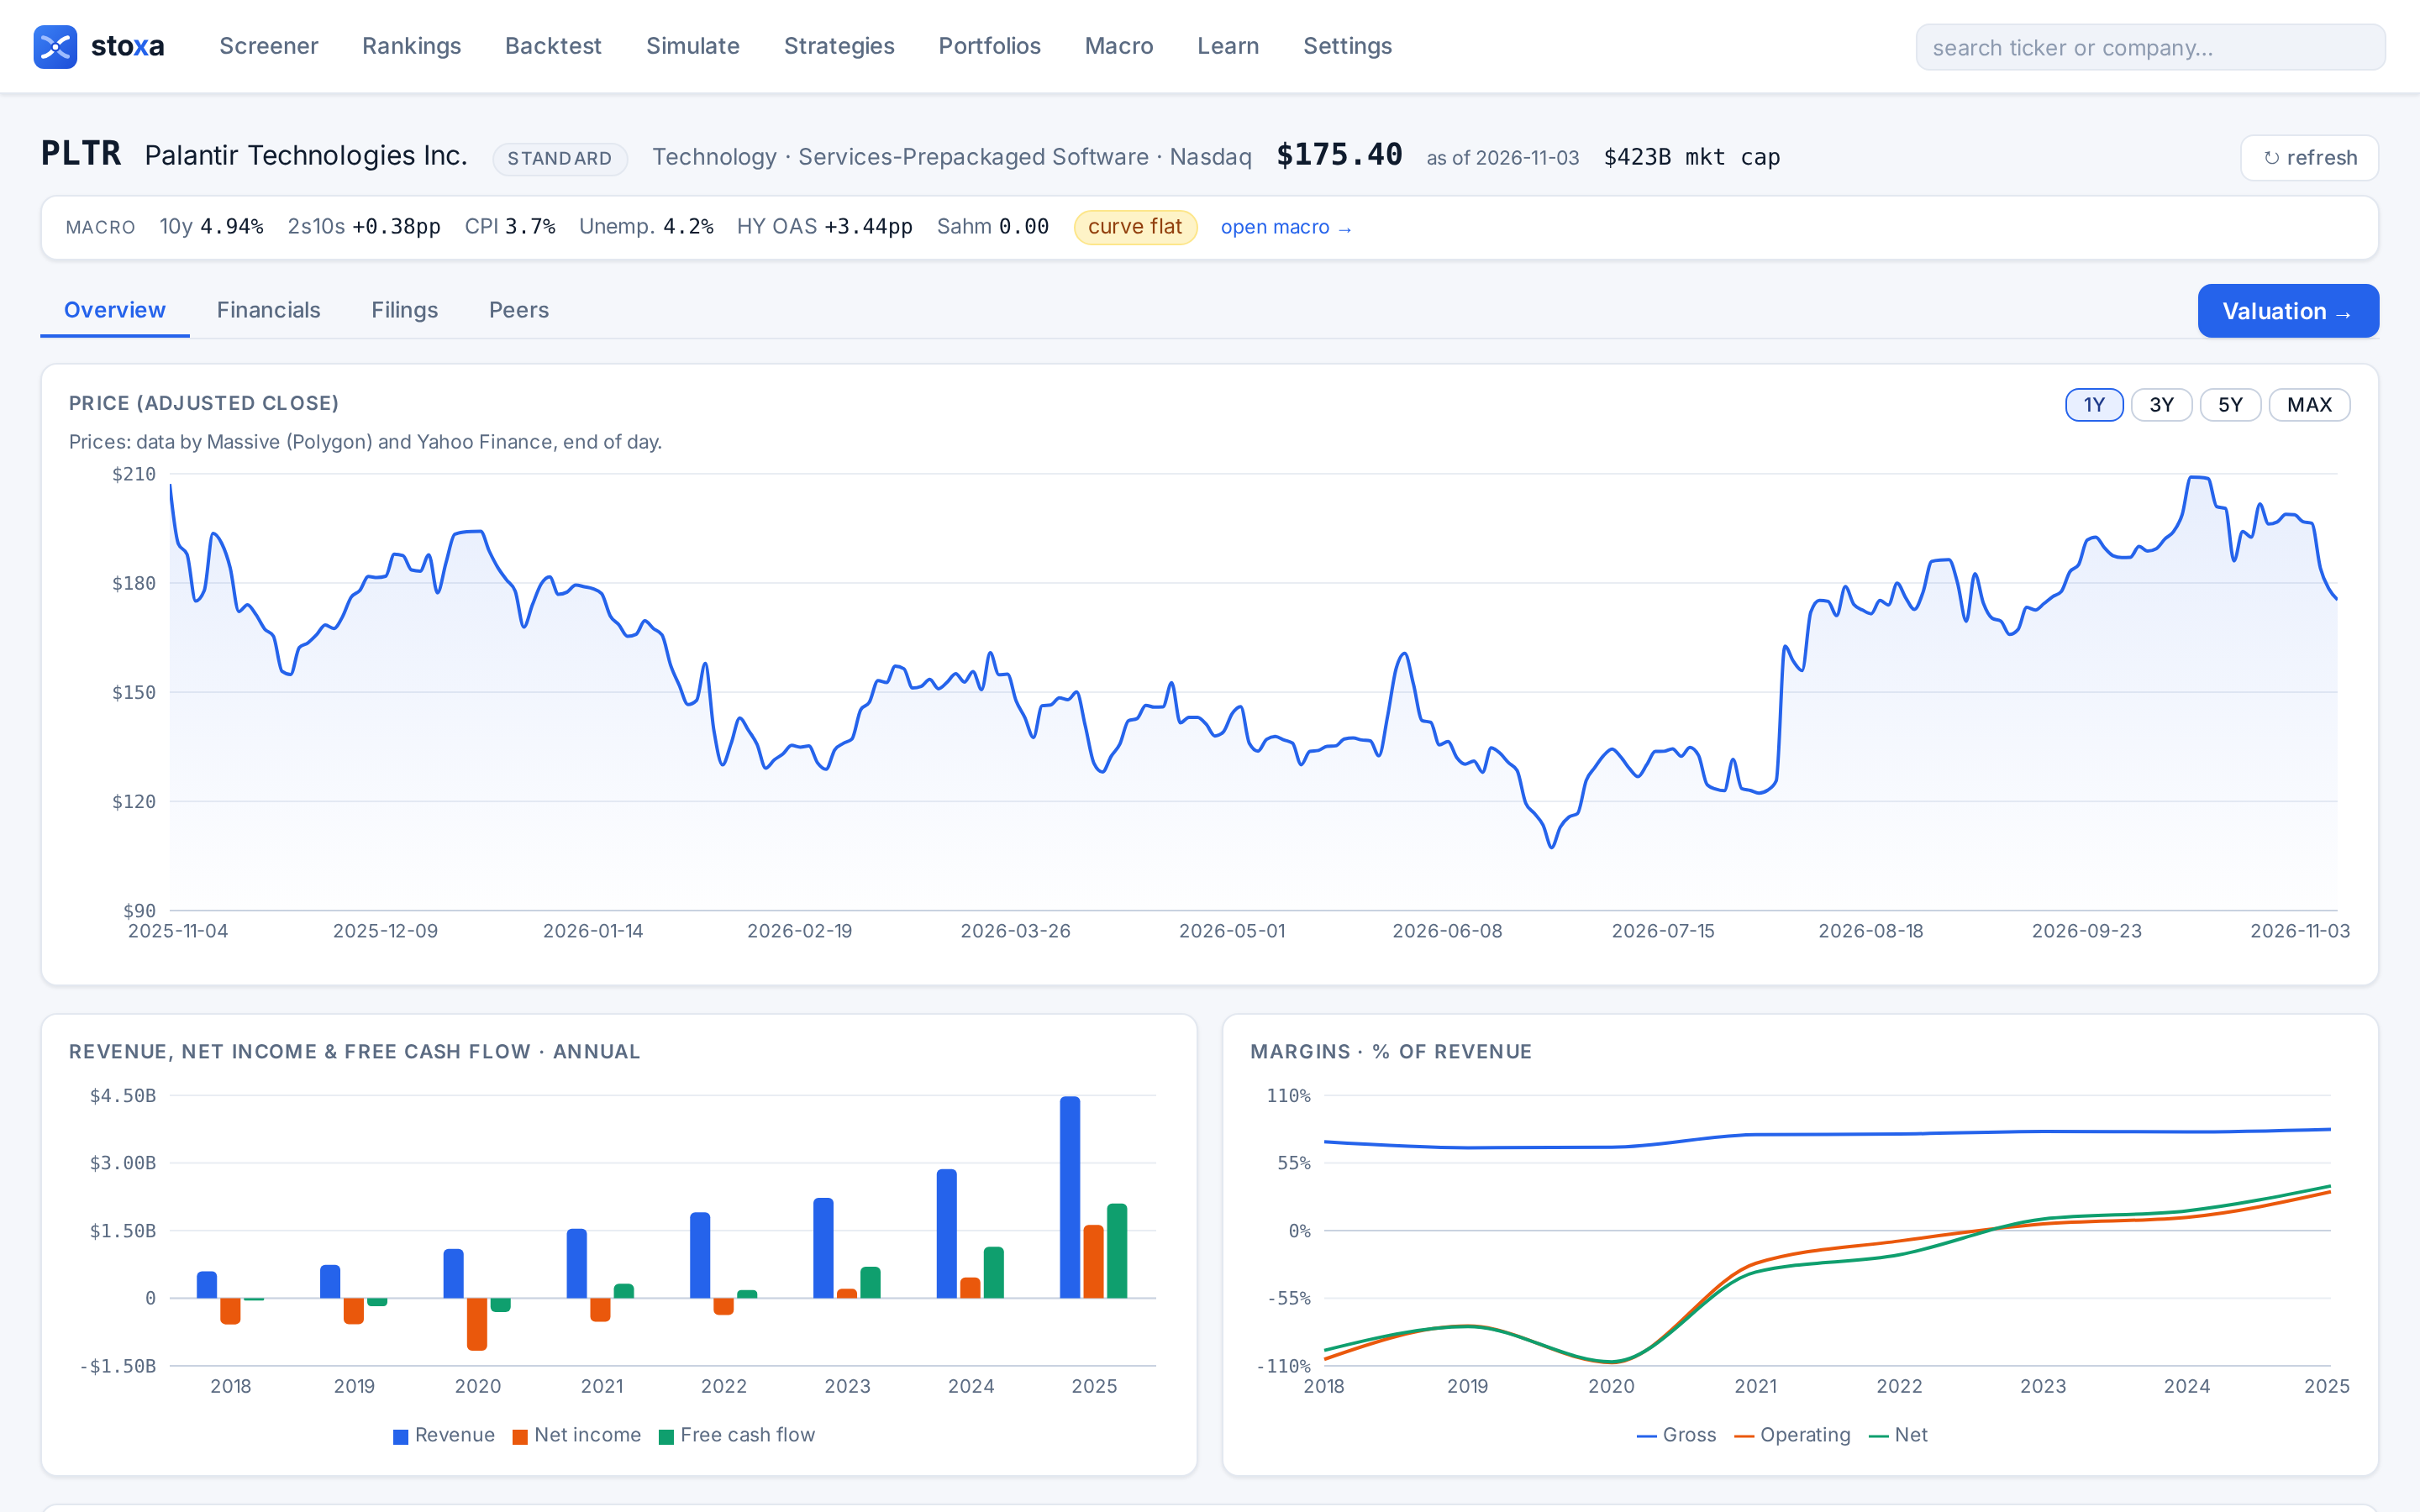
At $175.40 the company is worth $423B, with $10.6B of cash and Treasuries and no debt. That is 57× trailing revenue, 124× trailing operating profit and 75× the consensus earnings for 2027. There is no multiple in the large-cap universe to compare that with, so the only honest way to value it is to write down what the business has to become and discount it. That is what the Stoxa workbench is for, and this analysis does it in the open: the defaults, why they fail on a company growing this fast, three scenarios with the story behind each, the reverse DCF, two sensitivity grids and a Monte Carlo.
Our conclusion: $175 is a bet on a decade, not on a quarter. Our base case has Palantir growing revenue to $82B by 2036, more than Oracle makes today, at a 45% GAAP operating margin, and it is worth about $100 a share. To justify the price on the same margin you need year-one growth of roughly 80% fading over the full ten years, which is revenue near $197B in 2036: Microsoft’s revenue of 2022, reached from $8.5B in ten years. Our bull case gets there and is worth $203. A Monte Carlo around the base case puts the probability that intrinsic value exceeds the price at 3%. Nothing in the quarter argues against the business; everything in the price depends on growth of this order lasting far longer than any software company has sustained it.
- Price · 2026-11-03$175.40-16% from the October high
- Market cap · net cash$423Bcash and Treasuries $10.6B
- EV / revenue · EV / EBIT (TTM)57× · 124×revenue $7.3B, EBIT $3.3B
- Revenue growth · GAAP margin, Q3+96% · 47%adjusted margin 62%
- Stoxa base case$100-43% vs price
- Bear · bull$43 · $203P(value > price) 3%
- PLTR close
- Bull
- Base
- Bear
Prices: Stoxa price store (Massive and Yahoo Finance, split-adjusted close). Scenario values: Stoxa valuation workbench on filings to 2026-11-03, assumptions in the scenarios section below.
Data
| Month end | Close |
|---|---|
| 2024-01 | $16.09 |
| 2024-02 | $25.08 |
| 2024-03 | $23.01 |
| 2024-04 | $21.97 |
| 2024-05 | $21.68 |
| 2024-06 | $25.33 |
| 2024-07 | $26.89 |
| 2024-08 | $31.48 |
| 2024-09 | $37.20 |
| 2024-10 | $41.56 |
| 2024-11 | $67.08 |
| 2024-12 | $75.63 |
| 2025-01 | $82.49 |
| 2025-02 | $84.92 |
| 2025-03 | $84.40 |
| 2025-04 | $118.44 |
| 2025-05 | $131.78 |
| 2025-06 | $136.32 |
| 2025-07 | $158.35 |
| 2025-08 | $156.71 |
| 2025-09 | $182.42 |
| 2025-10 | $200.47 |
| 2025-11 | $168.45 |
| 2025-12 | $177.75 |
| 2026-01 | $146.59 |
| 2026-02 | $137.19 |
| 2026-03 | $146.28 |
| 2026-04 | $139.11 |
| 2026-05 | $156.54 |
| 2026-06 | $116.67 |
| 2026-07 | $123.06 |
| 2026-08 | $186.38 |
| 2026-09 | $187.05 |
| 2026-10 | $184.11 |
| 2026-11 | $175.40 |
What Palantir has become
For its first fifteen years Palantir was a services-heavy software company that sold two platforms, Gotham to governments and Foundry to large enterprises, through long bespoke deployments, and lost money doing it. The company listed directly in September 2020 at a reference price of $7.25, lost $1.2 billion that year on $1.1 billion of revenue (most of it the stock compensation that vested on listing), and traded down to $6 in December 2022. The current business is different in kind. The Artificial Intelligence Platform, launched in 2023, sits on the same ontology (the data model of an organisation’s objects, people, assets and processes that Foundry builds) and lets customers put large language models to work on it in days through what the company calls bootcamps. The result has been a sales motion that starts small and expands at a speed the software industry has not seen: management’s examples from the third quarter include a $3 million pilot that became a $29 million annual contract, and a $1.6 million pilot that became $21 million.
- Reported
- Guided
SEC filings via Stoxa (XBRL company facts). 2026: company guidance of $8.53B to $8.53B.
Data
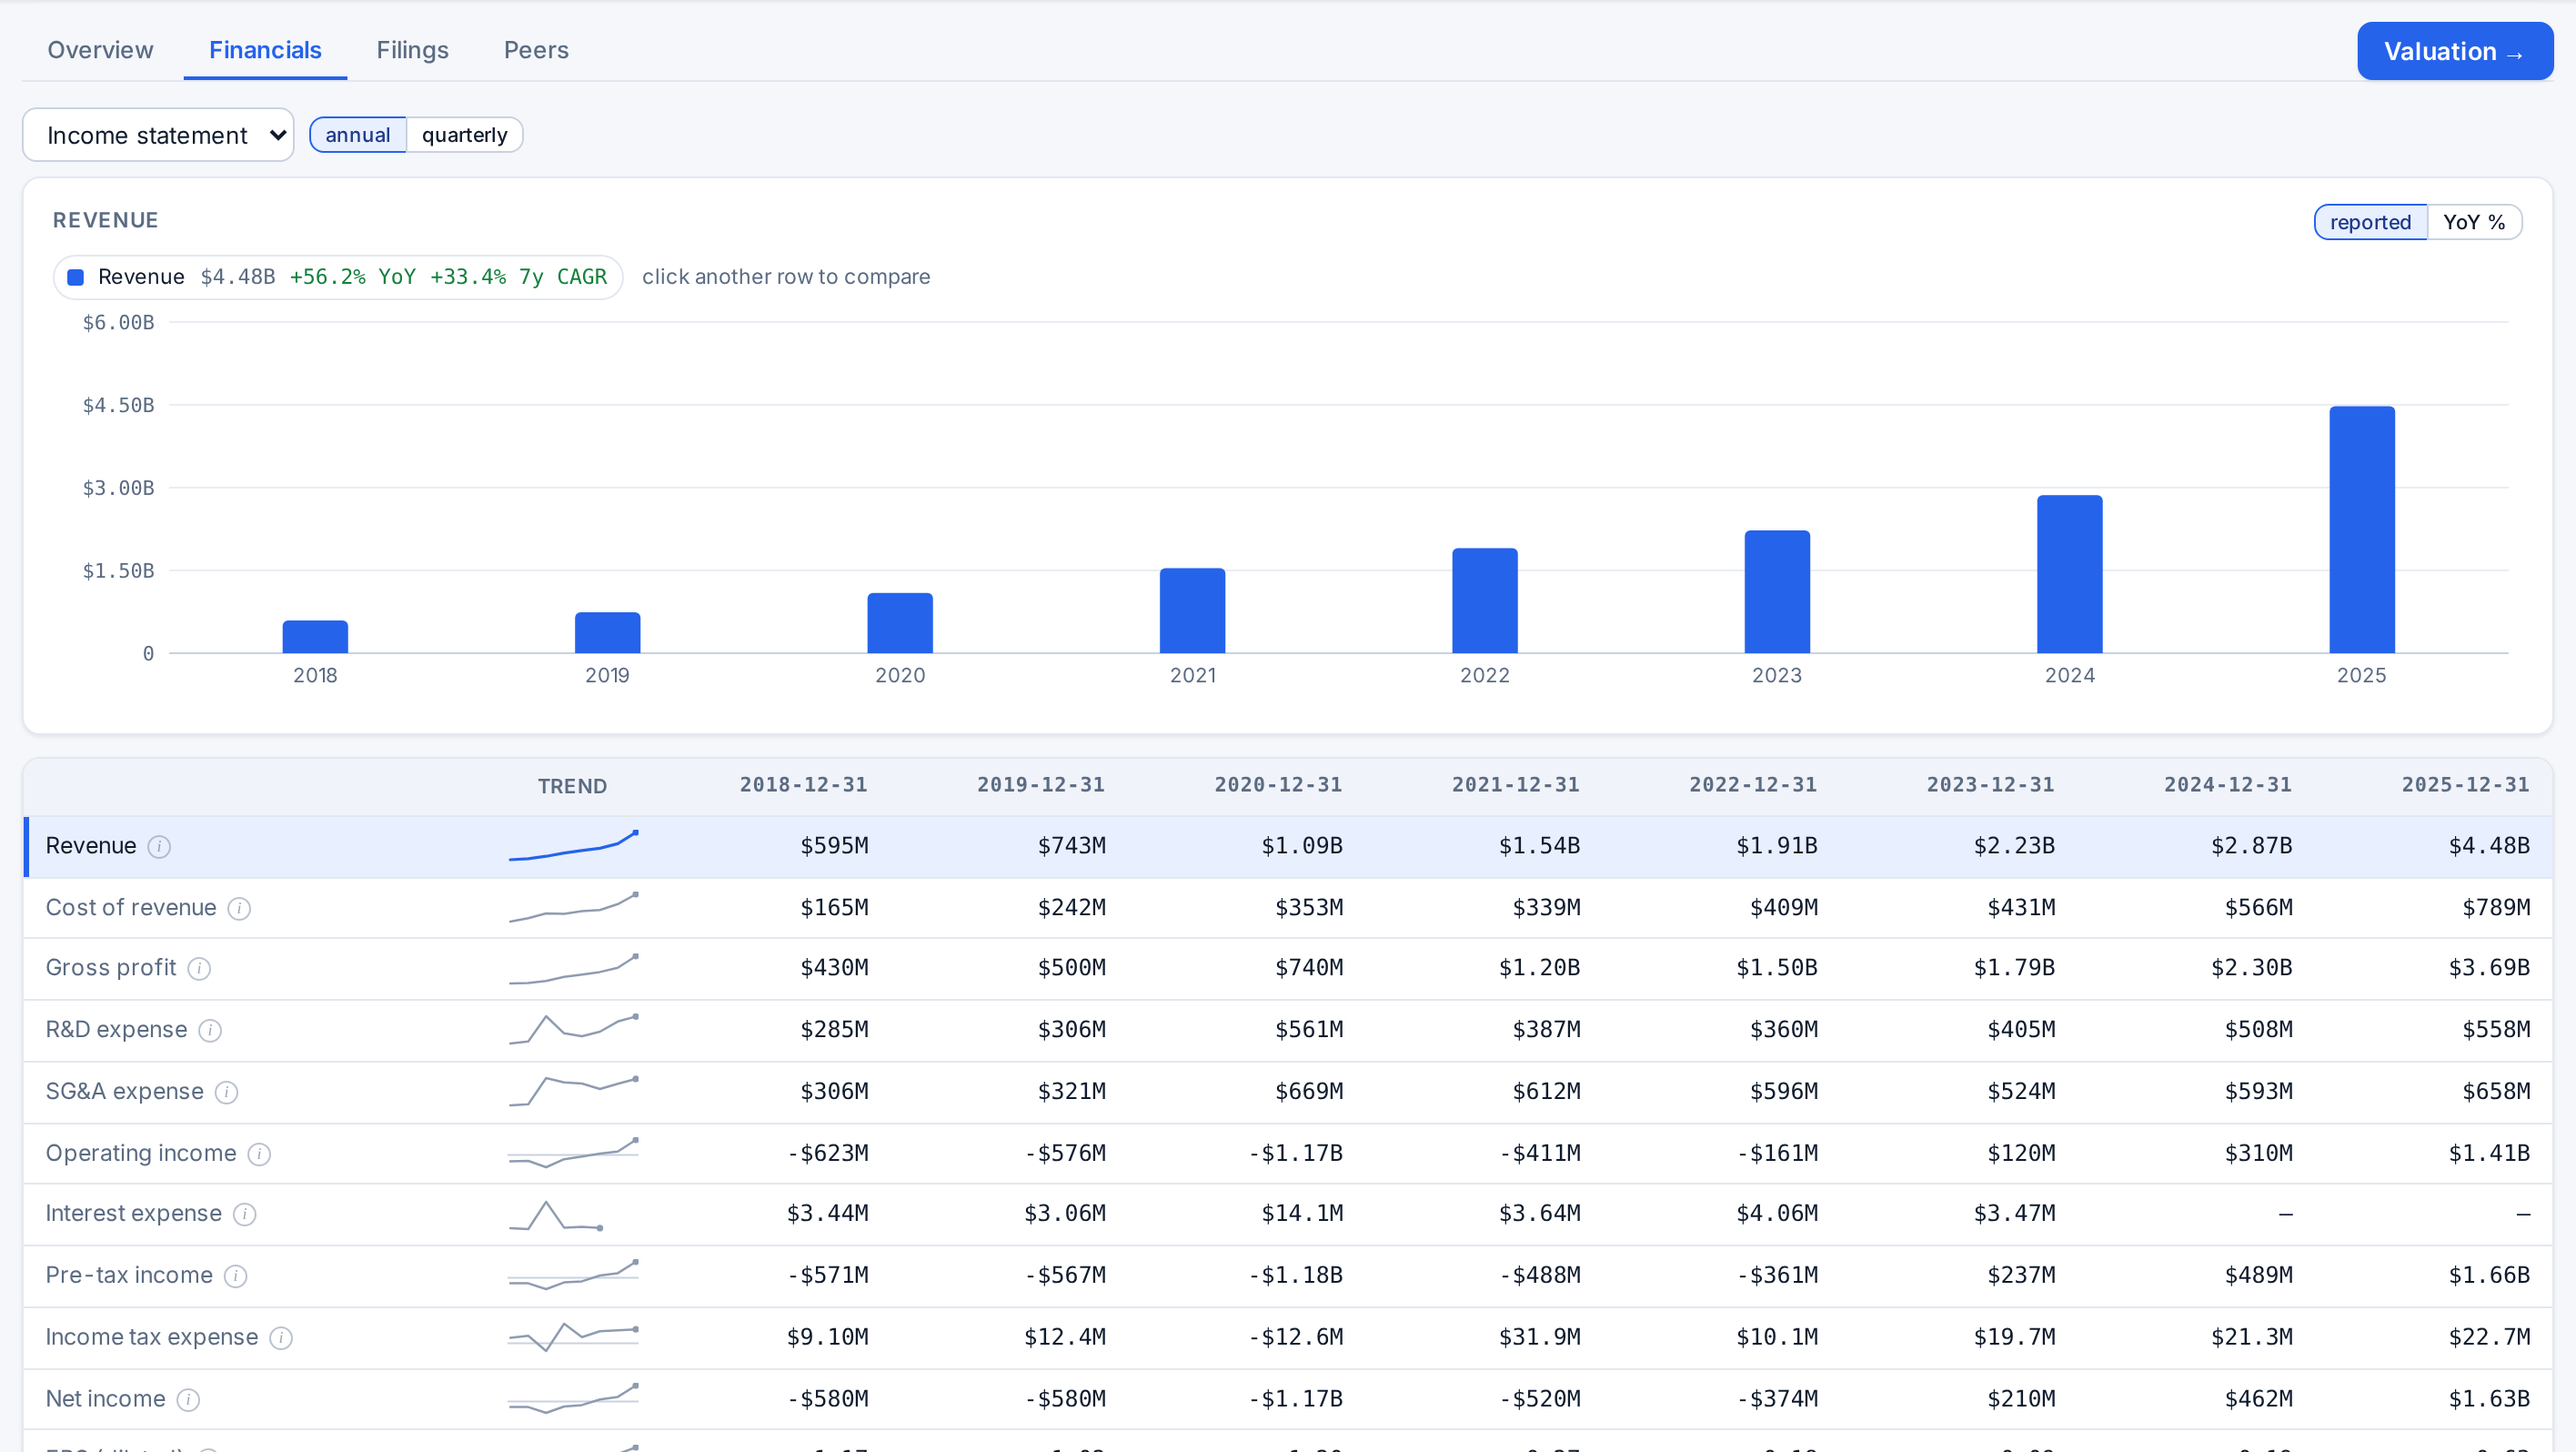
| Year | Revenue | Growth |
|---|---|---|
| 2018 | $0.60B | |
| 2019 | $0.74B | +25% |
| 2020 | $1.09B | +47% |
| 2021 | $1.54B | +41% |
| 2022 | $1.91B | +24% |
| 2023 | $2.23B | +17% |
| 2024 | $2.87B | +29% |
| 2025 | $4.48B | +56% |
| 2026 guide | $8.53B | +91% |
SEC filings via Stoxa. Trailing twelve months to September 2026: 45.6%.
Data
| Year | Operating margin | Stock compensation, % of revenue |
|---|---|---|
| 2018 | -104.7% | 42% |
| 2019 | -77.6% | 33% |
| 2020 | -107.4% | 116% |
| 2021 | -26.7% | 50% |
| 2022 | -8.5% | 30% |
| 2023 | 5.4% | 21% |
| 2024 | 10.8% | 24% |
| 2025 | 31.6% | 15% |
Three things about the financial record matter for the valuation. First, the operating leverage is real and recent: the company was loss-making on a GAAP basis until 2023, crossed a 30% margin in the third quarter of 2025 and a 46% margin in the first quarter of 2026, with gross margin above 83% and operating expenses growing at about half the pace of revenue. Second, stock compensation is a large real cost, $0B in the quarter or 14% of revenue, and it is the entire gap between the 62% adjusted margin the company headlines and the 47% GAAP margin we model. We use the GAAP figure throughout; a share granted to an engineer is a share not owned by you. Third, the balance sheet is irrelevant to the value in the good sense: $10.6B of cash and Treasuries, $0.23B of debt (lease liabilities), and capital expenditure of about $30 million a year on $7 billion of revenue. Nearly all of operating profit converts to free cash flow.
The acceleration, quarter by quarter
The unusual thing about Palantir’s growth is not its level but its direction. Most companies that grow at 50% a year are decelerating from 80%; Palantir’s year-on-year growth rate has risen for thirteen consecutive quarters, from 13% in the June quarter of 2023 to 96% in the latest one, and the operating margin rose with it. The margin curve is now flat: three quarters in a row at 46 to 47%, which is where the company is choosing to run it while it hires.
- Reported
- Guided
10-Q and 10-K filings via Stoxa. Fourth-quarter 2026 is the guidance midpoint ($2.65B).
Data
| Quarter | Revenue | Growth y/y |
|---|---|---|
| Q1 22 | $0.45B | |
| Q2 22 | $0.47B | |
| Q3 22 | $0.48B | |
| Q4 22 | $0.51B | |
| Q1 23 | $0.53B | +18% |
| Q2 23 | $0.53B | +13% |
| Q3 23 | $0.56B | +17% |
| Q4 23 | $0.61B | +20% |
| Q1 24 | $0.63B | +21% |
| Q2 24 | $0.68B | +27% |
| Q3 24 | $0.73B | +30% |
| Q4 24 | $0.83B | +36% |
| Q1 25 | $0.88B | +39% |
| Q2 25 | $1.00B | +48% |
| Q3 25 | $1.18B | +63% |
| Q4 25 | $1.41B | +70% |
| Q1 26 | $1.63B | +85% |
| Q2 26 | $1.94B | +93% |
| Q3 26 | $2.31B | +96% |
- Operating margin
- Sector norm 20%
10-Q and 10-K filings via Stoxa. The dotted line is the 20% sector norm the workbench uses for software.
Data
| Quarter | Operating margin |
|---|---|
| Q1 22 | -8.8% |
| Q2 22 | -8.8% |
| Q3 22 | -13.0% |
| Q4 22 | -3.5% |
| Q1 23 | 0.8% |
| Q2 23 | 1.9% |
| Q3 23 | 7.2% |
| Q4 23 | 10.8% |
| Q1 24 | 12.8% |
| Q2 24 | 15.5% |
| Q3 24 | 15.6% |
| Q4 24 | 1.3% |
| Q1 25 | 19.9% |
| Q2 25 | 26.8% |
| Q3 25 | 33.3% |
| Q4 25 | 40.9% |
| Q1 26 | 46.2% |
| Q2 26 | 47.1% |
| Q3 26 | 46.9% |
The third quarter in the company’s own figures, with the two numbers the market reacted to in bold:
| Metric | Q3 2026 | Note |
|---|---|---|
| Revenue | $2.313B, +96% y/y, +20% q/q | guided $2.16B; first quarter above $2B |
| US commercial revenue | $1B, +148% y/y | 686 customers, +29% y/y |
| US government revenue | $1B, +96% y/y | Army TITAN award, Maven past 100,000 users |
| International commercial | $0B, +21% y/y | the one slow segment; 8% of revenue |
| GAAP operating income | $1.08B, 47% margin | adjusted $1.43B, 62%; the gap is $0B of stock compensation |
| GAAP net income | $1.13B, $0.44 a share | tax rate about 1%: loss carry-forwards |
| Adjusted free cash flow | $1.22B, 53% margin | full-year guide $4.8B to $5.0B |
| Net dollar retention | 165% | +8 points q/q: existing customers spent 65% more than a year ago |
| Total contract value booked | $2.92B, +6% y/y | US commercial TCV $1.46B, +11% y/y; "multiple 8-figure deals that were shorter in duration than usual" |
| Remaining deal value | $13.4B, +55% y/y | only +2% q/q; US commercial $6.5B, +4% q/q |
| Q4 2026 guidance | $2.649B to $2.653B | about +88% y/y; full year $8.53B to $8.53B |
The bookings numbers are why the stock fell, and they deserve a fair reading in both directions. Total contract value is lumpy and the comparison was against a quarter with a very large Army contract. Management’s explanation, that new AI deals are deliberately shorter so that they can be expanded sooner, is consistent with the retention figure and with the pilot-to-contract examples. But remaining deal value, the stock of contracted future revenue, grew 55% while revenue grew 96%, and only 2% in the quarter. A backlog growing slower than revenue is the first thing that happens before growth decelerates. It has not decelerated yet; the fourth-quarter guide implies about 88%. The question for the valuation is not 2026 but 2029 and beyond, and the bookings are the only evidence we have about that.
What the workbench says out of the box, and why it is wrong here
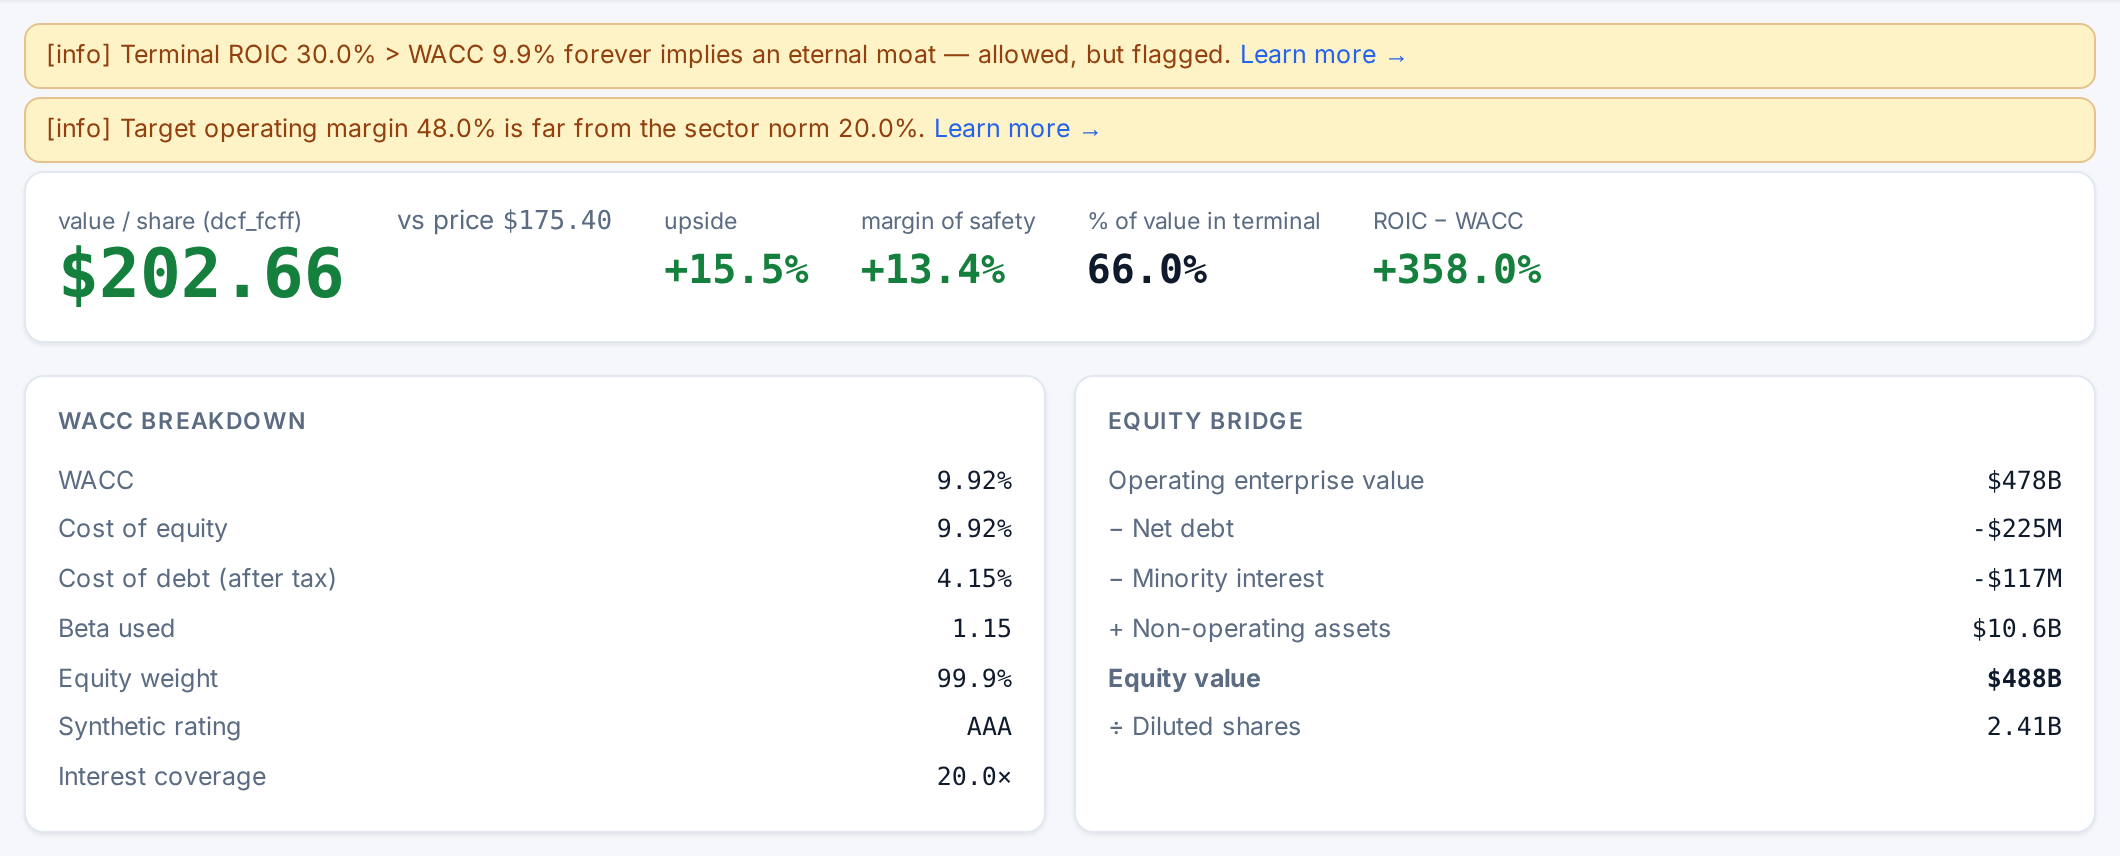
We start every analysis with the defaults: Damodaran-style base-case rules applied mechanically to the filings, each labelled with where it came from. They are not meant to be right for every company; they are meant to be visible, so that each departure is a decision you can see and argue with. On Palantir, the defaults fail in an instructive way.
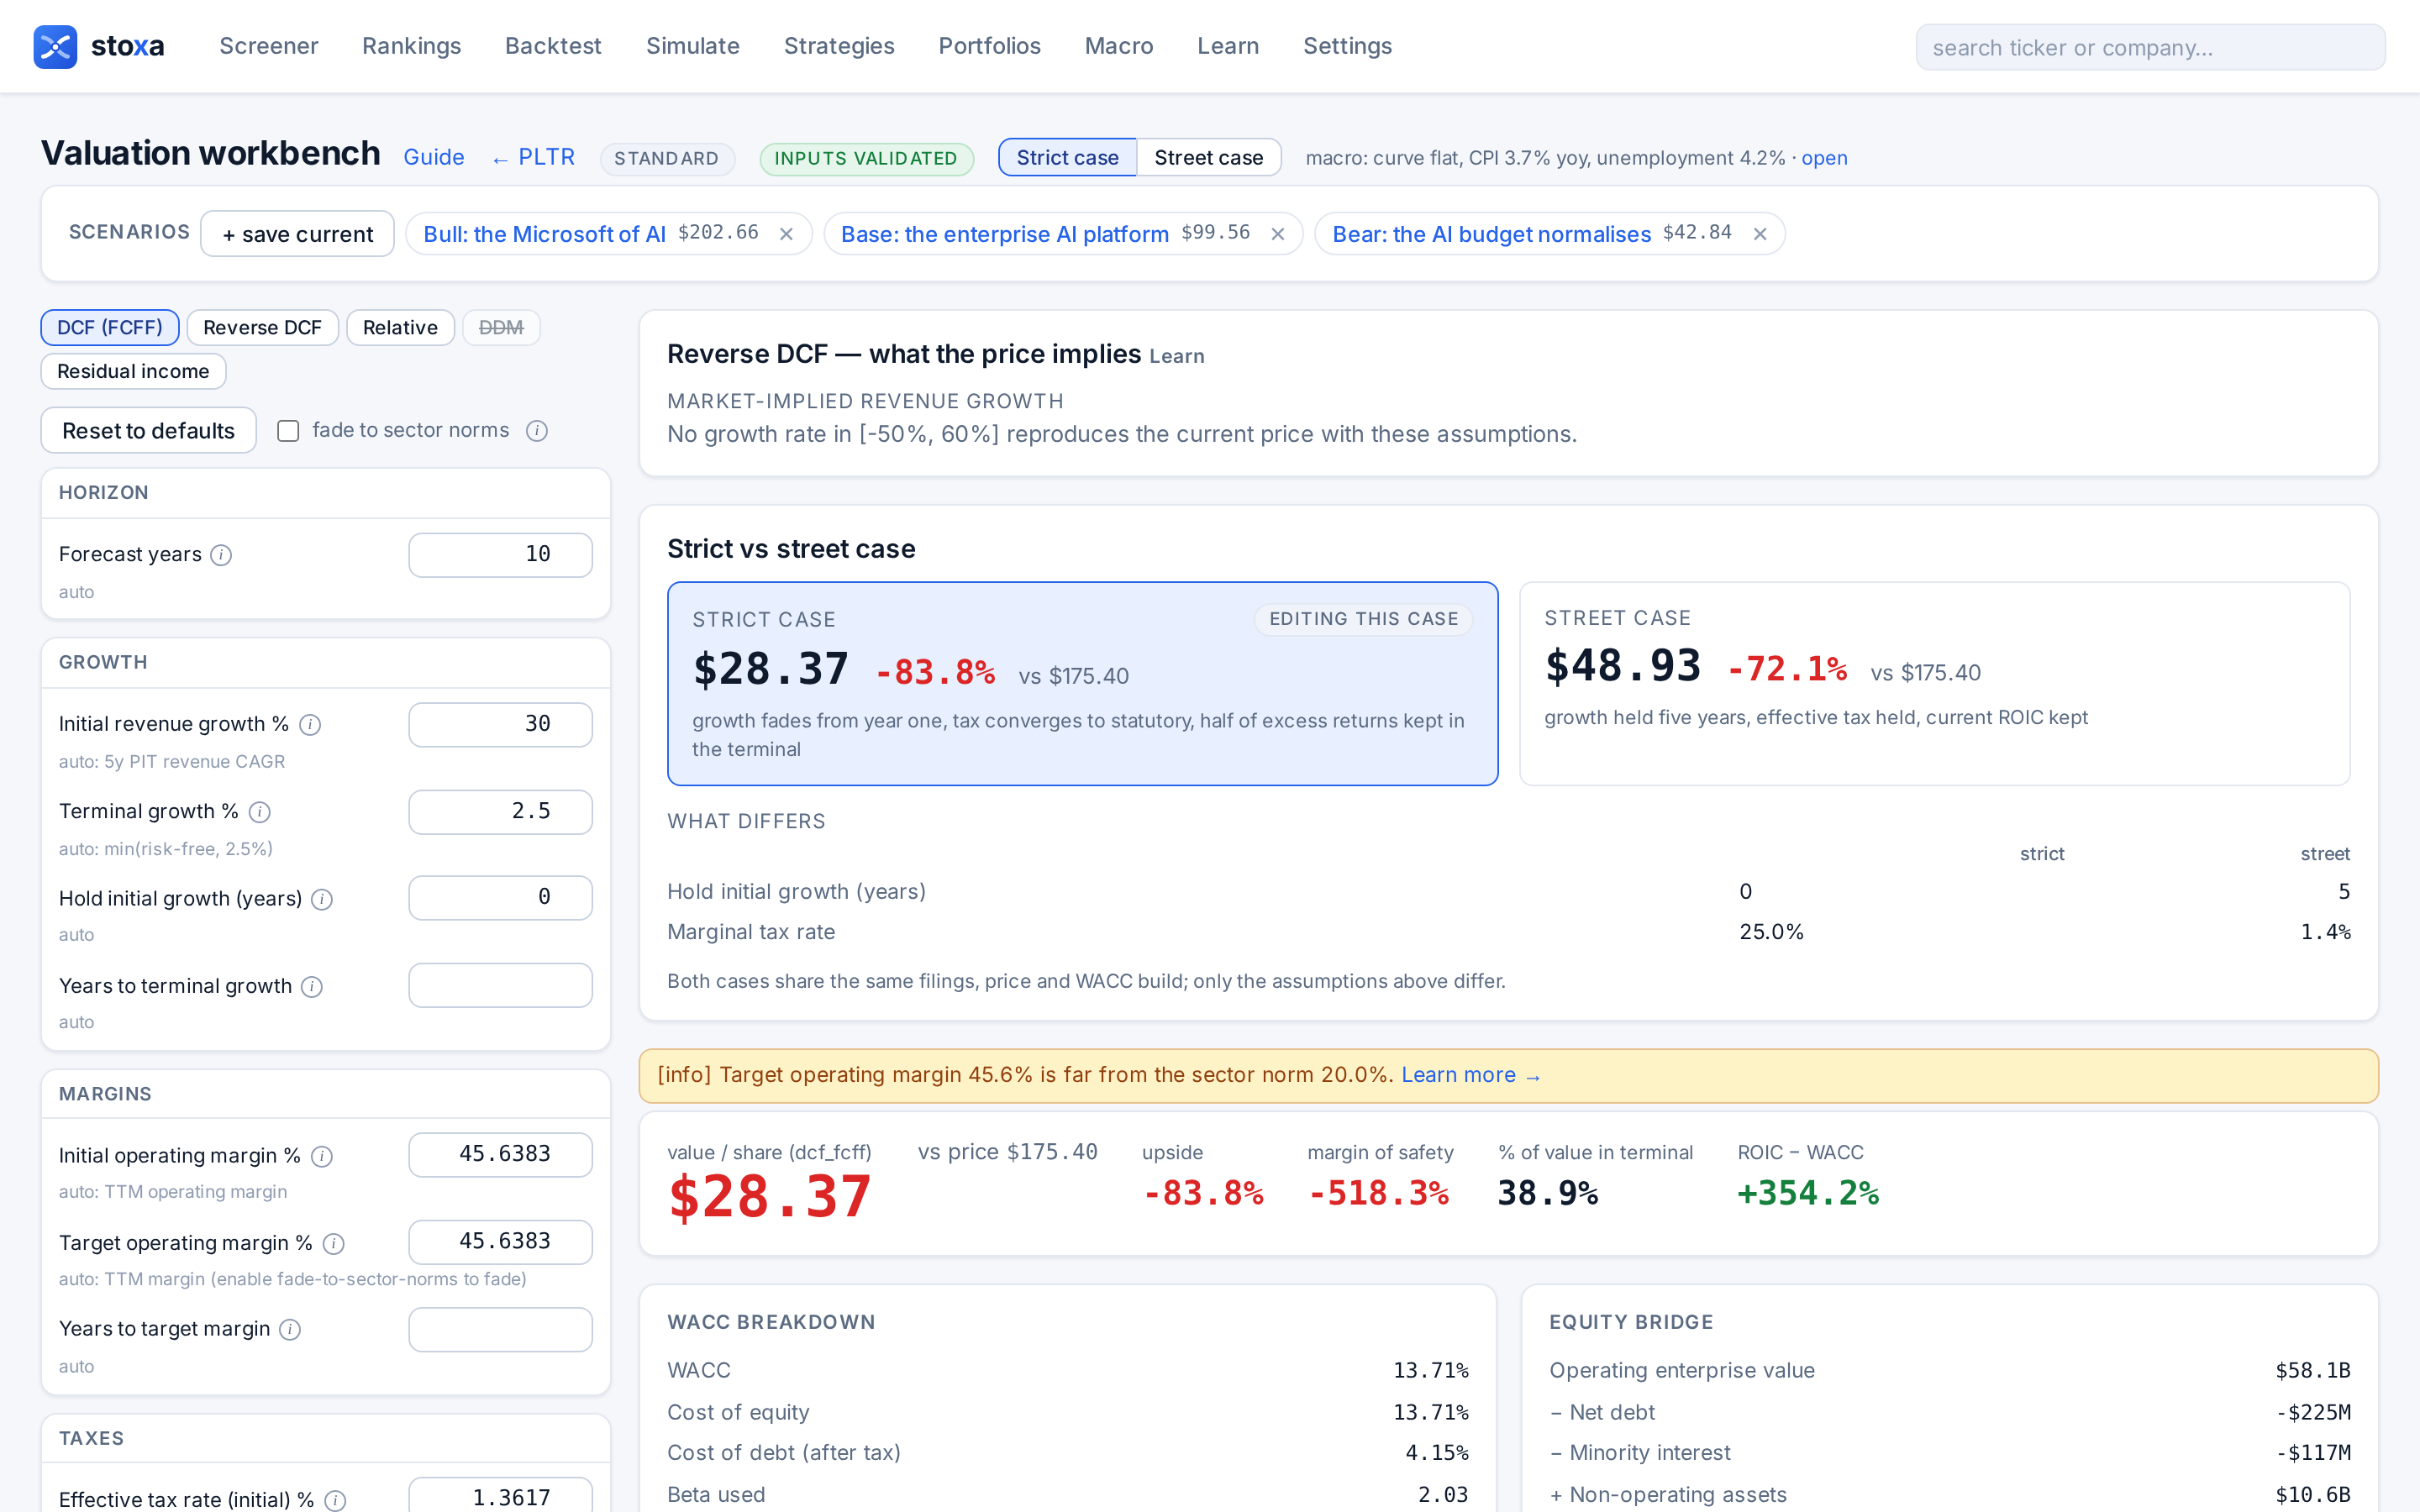
| Default | Value | Source label | Why it fails for Palantir |
|---|---|---|---|
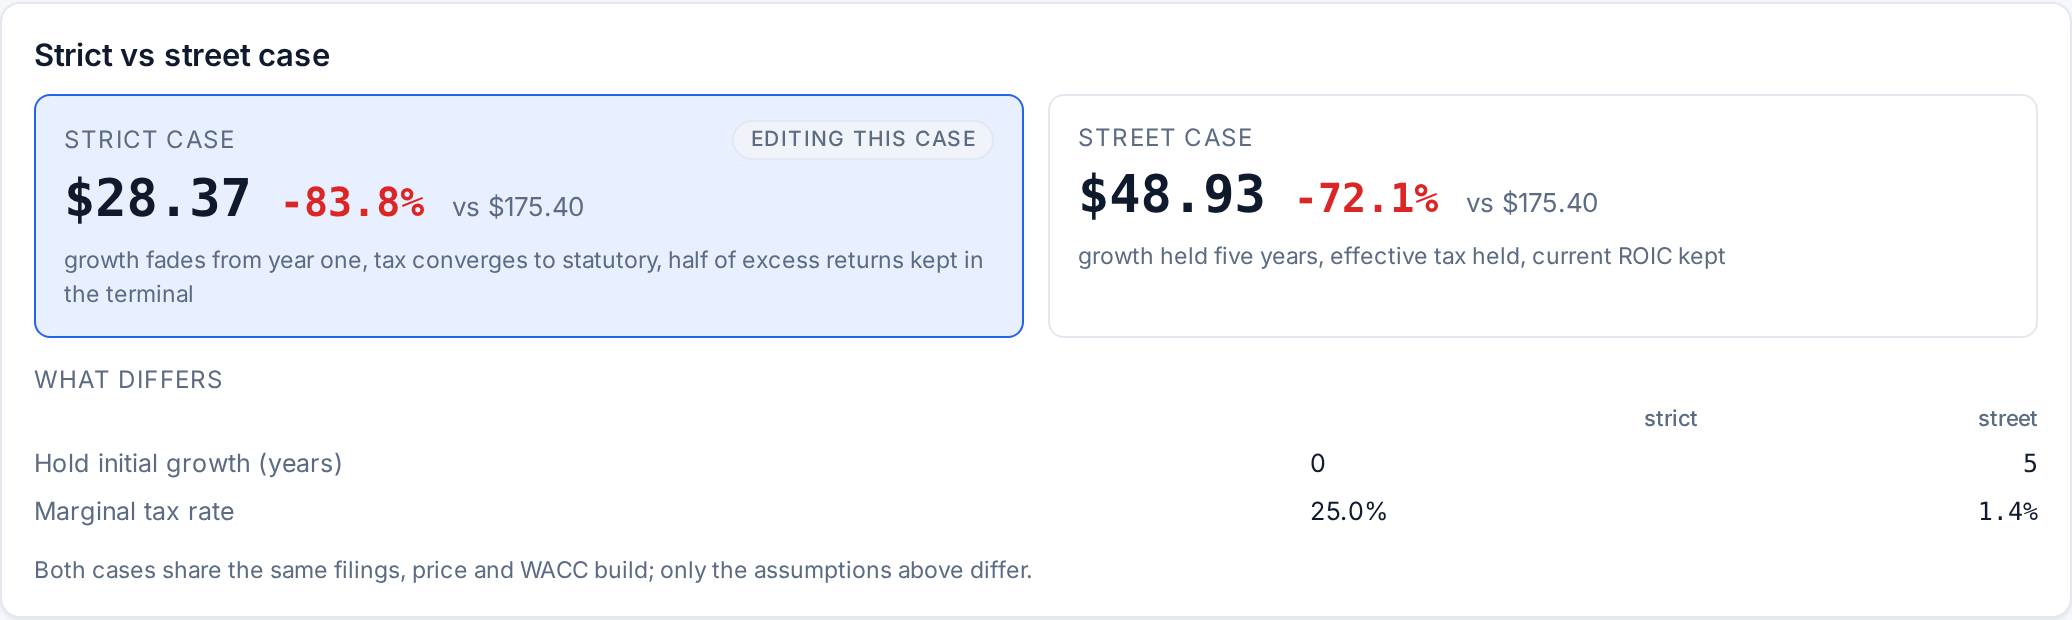
| Initial revenue growth | 30% | auto: 5y PIT revenue CAGR | the five-year CAGR is above 45% but the default caps it at 30% as a guardrail; and the strict preset fades it from year one, so year-one revenue ($9.5B) is below the fourth-quarter run-rate of $10.6B the company has already guided to |
| Operating margin | 45.6% held | auto: TTM operating margin | reasonable as a starting point; the engine flags that 46% is far from the 20% software norm, which is the right warning on most companies and wrong on this one |
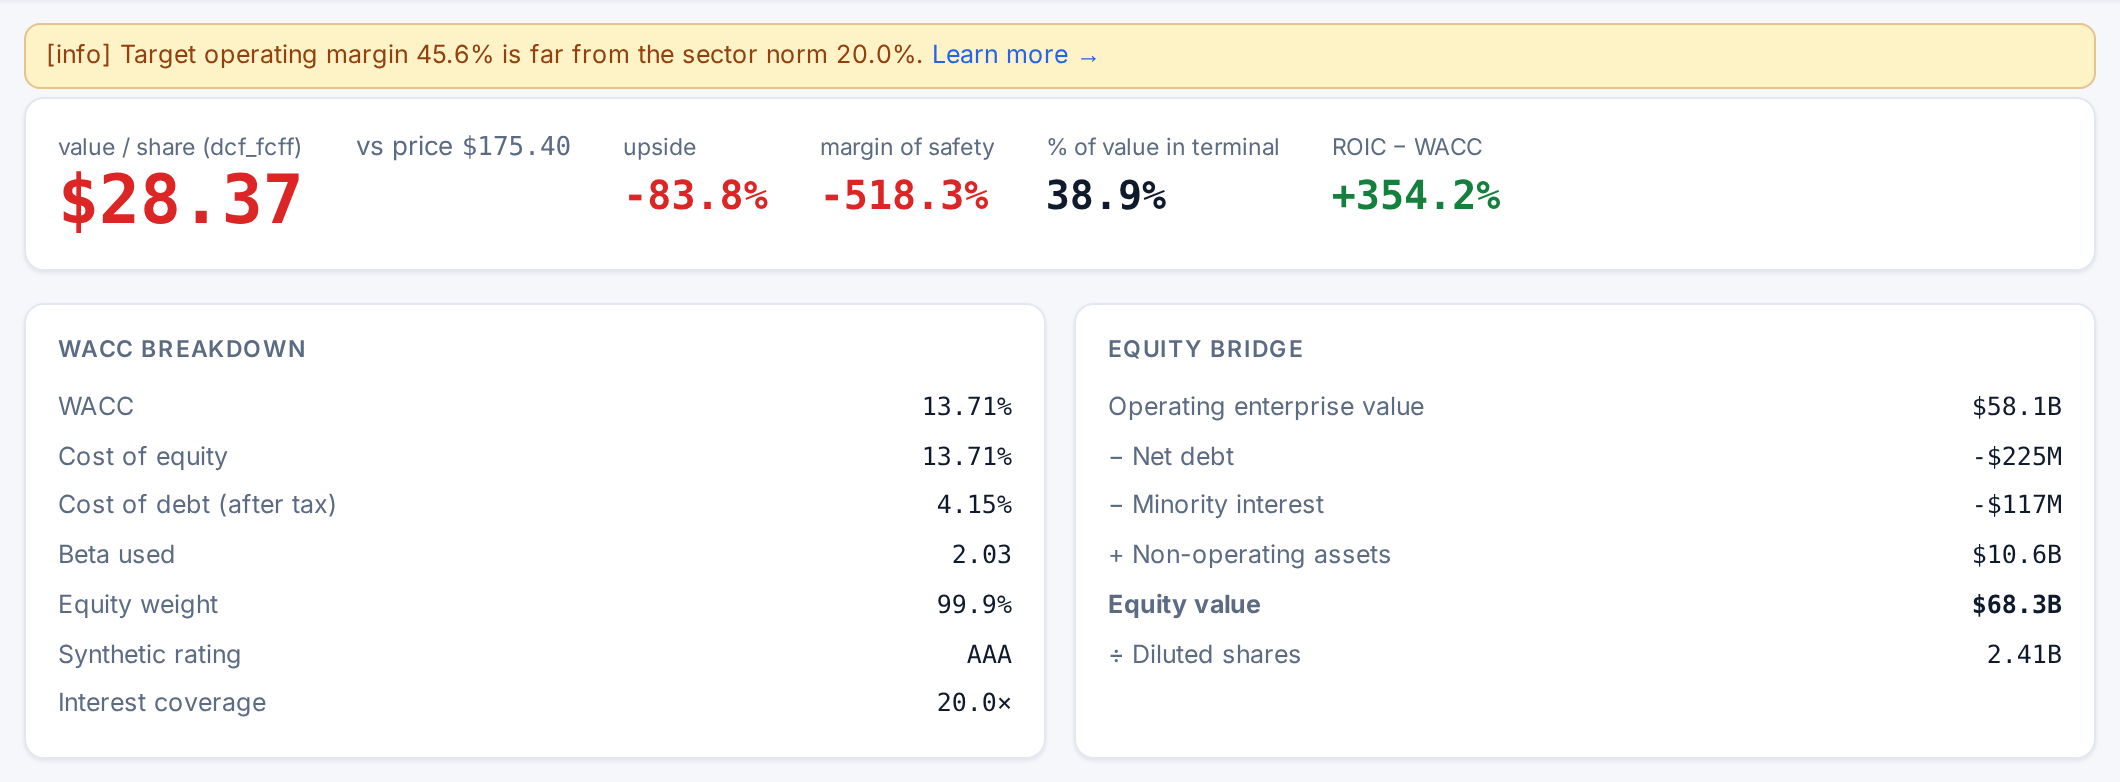
| Beta | 2.03 | auto: regression vs SPY (Blume-smoothed) | a regression on a stock that went from $6 to $209 in four years measures the stock's behaviour, not the business's. It gives a 13.7% discount rate. The bottom-up beta from the sector is 1.15, for a WACC of 9.92% |
| Terminal ROIC | equal to WACC | auto: = WACC (no excess returns in perpetuity) | no excess returns in perpetuity is the right default for a commodity business; for a software platform with 165% net retention it removes most of the value |
| Sales-to-capital | 3.0 | auto: 3.0 (grew with capex ≤ D&A over 5y; asset-light assumption) | we keep it: Palantir barely needs capital to grow, and 3.0 is already the asset-light assumption |
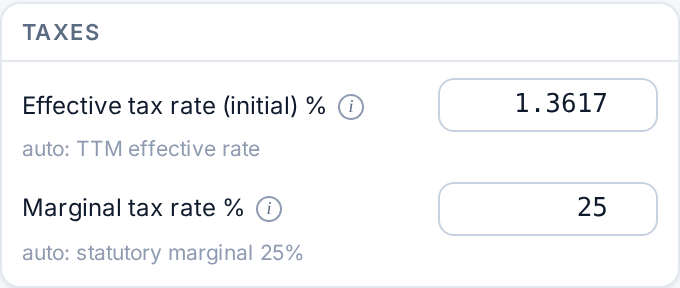
| Tax rate | 1.4% to 25% | auto: statutory marginal 25% | we keep it: the near-zero rate is loss carry-forwards and will converge; the street preset holds it at 1.4% forever, which flatters its value |
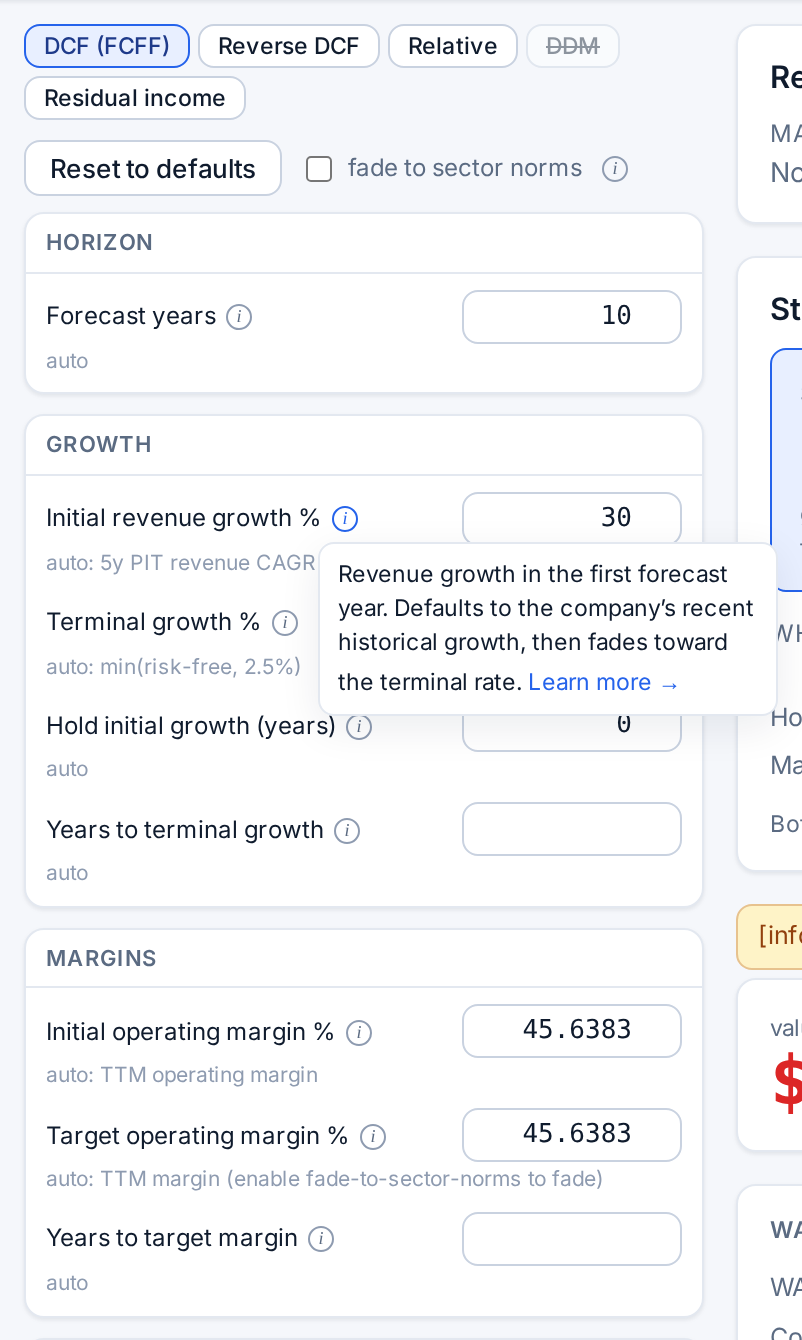
The strict default is worth $28 and the street preset $49. Both are far below the price, and both are wrong for the same reason: they discount a company growing 90% a year at a 13.7% cost of capital while assuming its growth starts fading immediately or that its returns on capital collapse to the cost of capital in year eleven. Switching only the beta to the bottom-up method lifts the strict value to $40; the rest of the gap to the price is growth, and how long it lasts.
Three scenarios we can defend
All three scenarios share the same discount rate (9.92%, from the bottom-up beta of 1.15 and a 4.94% ten-year Treasury yield), the same starting margin of 46%, the same tax path from 1.4% to 25%, and the workbench’s rule that growth is paid for with reinvestment. They differ in how long hypergrowth lasts, where the GAAP margin settles once hiring stops outrunning revenue, and how much the company keeps earning above its cost of capital in perpetuity.
| Bear: the AI budget normalises | Base: the enterprise AI platform | Bull: the Microsoft of AI | |
|---|---|---|---|
| The story | The AI budget cycle peaks in 2027; competitors from the model labs and hyperscalers compress pricing; growth fades to GDP by year six and the margin settles at 35% as stock compensation stays high | AIP becomes the standard enterprise and government AI platform in the US; growth fades over eight years; the GAAP margin creeps up to 45% as the company matures; returns on capital stay high | Palantir becomes the operating layer of enterprise AI globally: 70% growth holds for two years and fades over nine; a 48% margin, above Microsoft today; a 30% return on capital in perpetuity |
| Revenue growth | 60% in year one, fading to 2.5% by year six | 70% in year one, fading to 2.5% by year eight | 70% held two years, fading to 2.5% by year ten |
| Operating margin | 46% to 35% by year five | 46% to 45% by year six | 46% to 48% by year six |
| Sales-to-capital | 3.0 | 3.0 | 3.5 |
| Terminal ROIC | 15% | 25% | 30% |
| Year-5 revenue | $34B | $56B | $75B |
| Year-10 revenue | $38B | $82B | $178B |
| Year-10 operating income | $13B | $37B | $86B |
| Share of value in the terminal | 48% | 58% | 66% |
| Value per share | $43 | $100 | $203 |
| Against the price | -76% | -43% | +16% |
- Bull
- Base
- Bear
Stoxa valuation runs. For scale: Oracle’s trailing revenue is about $60B, Microsoft’s about $346B.
Data
| Year | Bear | Base | Bull |
|---|---|---|---|
| 1 | $11.7B | $12.4B | $12.4B |
| 2 | $17.3B | $19.9B | $21.1B |
| 3 | $23.7B | $29.9B | $34.0B |
| 4 | $29.8B | $42.2B | $52.1B |
| 5 | $33.9B | $55.5B | $75.4B |
| 6 | $34.8B | $67.6B | $103B |
| 7 | $35.7B | $75.8B | $131B |
| 8 | $36.6B | $77.7B | $157B |
| 9 | $37.5B | $79.7B | $174B |
| 10 | $38.4B | $81.7B | $178B |
- Bull
- Base
- Bear
Stoxa valuation runs. The dotted line is the 2.5% terminal growth rate every scenario fades to.
Data
| Year | Bear | Base | Bull |
|---|---|---|---|
| 1 | 60% | 70% | 70% |
| 2 | 49% | 60% | 70% |
| 3 | 37% | 51% | 62% |
| 4 | 25% | 41% | 53% |
| 5 | 14% | 31% | 45% |
| 6 | 2% | 22% | 36% |
| 7 | 2% | 12% | 28% |
| 8 | 2% | 2% | 19% |
| 9 | 2% | 2% | 11% |
| 10 | 2% | 2% | 2% |
The base case is not a cautious one. It has revenue at $56B in year five and $82B in year ten, eleven times the trailing figure and more than Oracle or SAP make today, at a 45% operating margin, with a 25% return on capital forever, which the workbench flags as an “eternal moat” because it is two and a half times the cost of capital. We think that is a fair description of what a dominant enterprise AI platform would look like. It is worth $100 a share, 43% below the price.
The bear case is what happens to most software companies that have grown this fast: Zoom went from 326% growth to 7% in two years; Snowflake from 124% to below 30% in four. Our bear is gentler than either history. Growth is still 60% in year one and revenue still reaches $38B by year ten, five times today’s, at a 35% margin that would rank among the best in software. It is worth $43. The bull case holds 70% growth for a second year and fades it over the full decade, with a 48% margin and a 30% perpetual return on capital. Year-ten revenue is $178B, about half of Microsoft today, and operating income $86B. It is worth $203, 16% above the price. Unlike the hard-drive analysis we published last week, where margin drove the gap between scenarios, here the gap is almost entirely growth duration: a 45% and a 48% margin are worth about the same; two more years of 50%-plus growth are worth $103 a share.

What you have to believe at $175
The workbench’s reverse DCF solves for the starting growth rate that makes the model equal the price. On the strict defaults it cannot: no growth rate up to the 60% ceiling of its search gets there with a 13.7% discount rate and growth that fades from year one. On the street preset, which holds growth for five years, the answer is 58.5% a year: 58% growth sustained through 2031, then fading. On our base-case structure (bottom-up beta, 45% margin, eight-year fade) the search again runs out of range, which is itself the finding: with growth fading linearly over eight years, no starting rate below 60% reaches the price.

So we ran the grid the other way: value against the starting growth rate and the number of years it takes to fade to 2.5%, holding the base-case margin and discount rate. The price sits on the diagonal between 80% growth fading over ten years ($204) and 90% fading over nine ($208); 70% over the full decade is only $152. In revenue terms, the 80%-over-ten-years path reaches $82B in year five and $197B in year ten, with operating income of $89B. Microsoft’s trailing operating income is $163B; so the price asks Palantir to become, in a decade, a company roughly half of today’s Microsoft, from a standing start of $8.5B.
| Years to fade to 2.5% ↓ / Starting revenue growth → | 50% | 60% | 70% | 80% | 90% |
|---|---|---|---|---|---|
| 4 years | $34 | $38 | $43 | $48 | $53 |
| 5 years | $40 | $46 | $53 | $61 | $70 |
| 6 years | $46 | $55 | $65 | $78 | $91 |
| 7 years | $53 | $66 | $81 | $99 | $120 |
| 8 years | $61 | $78 | $100 | $126 | $158 |
| 9 years | $71 | $94 | $123 | $160 | $208 |
| 10 years | $82 | $112 | $152 | $204 | $273 |
Stoxa sensitivity endpoint on the base scenario, 35 engine runs. Growth fades linearly from the starting rate to 2.5% over the number of years shown, then holds.
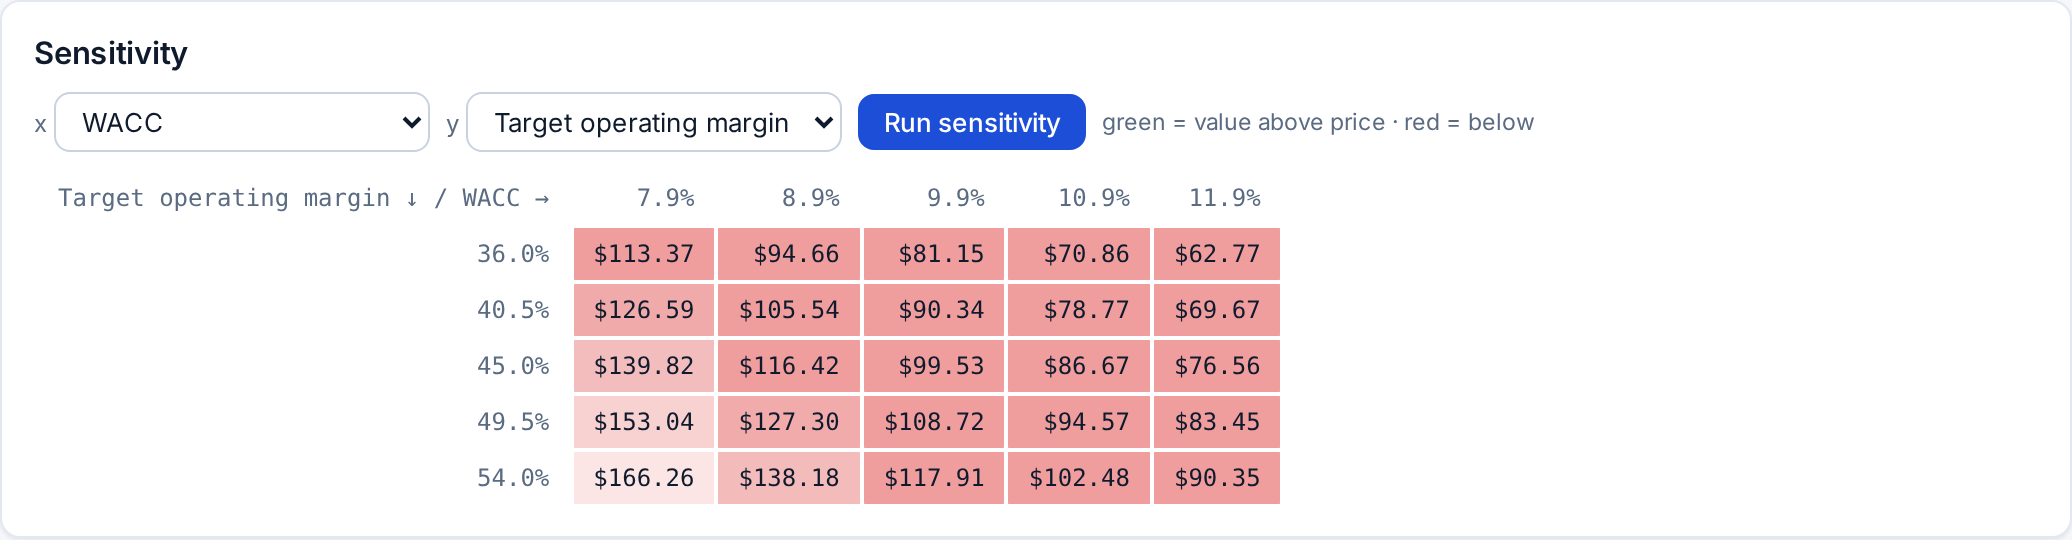
The second grid is the one the workbench draws by default, discount rate against the terminal margin. It shows how little the margin matters once growth is fixed: on the base-case growth path, a 55% margin, above anything in large-cap software, at an 8% discount rate is worth $167. No cell in the grid reaches the price. That is the central point of this analysis. Palantir’s price is not a margin story or a discount-rate story; it is a duration-of-growth story, and duration of growth is the one input no quarter can confirm.
| Terminal operating margin ↓ / WACC → | 8% | 9% | 10% | 11% | 12% |
|---|---|---|---|---|---|
| 30% | $94 | $79 | $68 | $60 | $53 |
| 35% | $109 | $91 | $78 | $68 | $61 |
| 40% | $123 | $103 | $88 | $77 | $68 |
| 45% | $138 | $115 | $98 | $86 | $76 |
| 50% | $152 | $127 | $108 | $94 | $83 |
| 55% | $167 | $139 | $119 | $103 | $91 |
Stoxa sensitivity endpoint on the base scenario, 30 engine runs. The workbench’s own grid is shown in the screenshot below.
Monte Carlo: how wide is the range
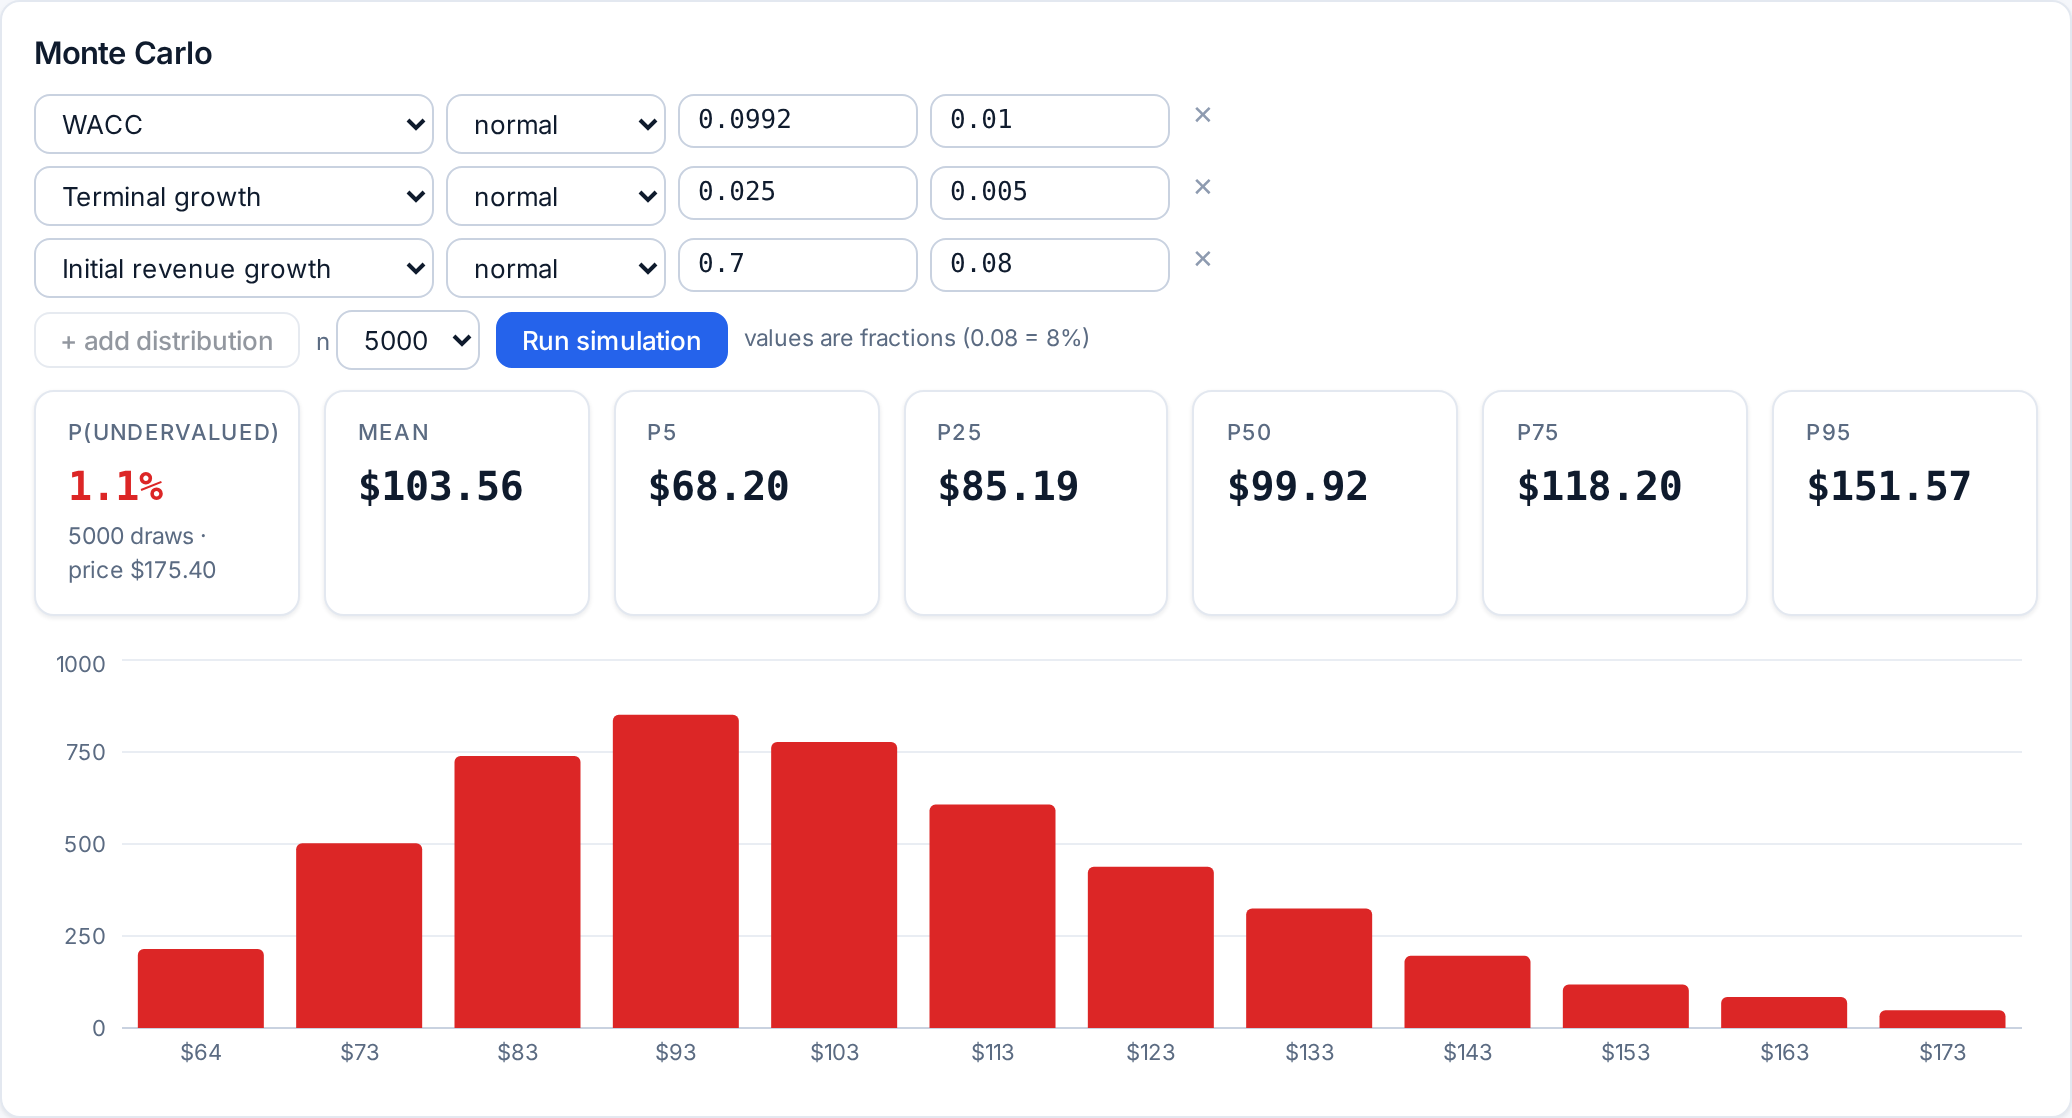
A point estimate hides how uncertain each input is, so we drew 20,000 valuations around the base case: starting growth normally distributed around 70% with a 12-point standard deviation, the terminal margin triangular between 30% and 52% with a mode of 45%, the discount rate normal around 9.9% with a one-point standard deviation, and terminal growth normal around 2.5% with a half-point standard deviation. What the simulation does not vary is the fade length, which stays at eight years; the grid above shows that is the input that matters most, so read this as the range given the base-case duration.
Stoxa Monte Carlo endpoint on the base scenario. Mean $100, median $94, 5th to 95th percentile $54 to $164; share of draws above the price 3.3%.
Data
| From | To | Share of draws |
|---|---|---|
| $44 | $57 | 5.7% |
| $57 | $71 | 13.5% |
| $71 | $84 | 17.1% |
| $84 | $98 | 17.3% |
| $98 | $112 | 14.6% |
| $112 | $125 | 11.2% |
| $125 | $139 | 7.3% |
| $139 | $152 | 4.8% |
| $152 | $166 | 2.9% |
| $166 | $180 | 1.8% |
| $180 | $193 | 1.1% |
| $193 | $207 | 0.7% |
The 95th percentile is $164, below the price. Within the base-case structure, the current price is about a one-in-thirty outcome. The screenshot below is the same simulation run inside the workbench with its three-input form (discount rate, terminal growth and starting growth), which is narrower because the margin is held at the base path; it gives the same answer.
Cross-checks: multiples and the software peers
The workbench’s relative model picks peers by size and sector, which for a $420 billion software company produces a list of large-cap technology and internet names (Oracle, SAP, Salesforce, Accenture, CrowdStrike, Alibaba, PDD) and implied values from $20 on EV/sales to $43 on price-to-free-cash-flow. Those are the multiples of companies growing 10 to 20%, and they say only what we already know: nothing about Palantir is priced like its peers. The hand-picked set below is more useful, because it shows what happens to the multiple when growth slows.
| PLTR | NOW | SNOW | DDOG | CRWD | MSFT | |
|---|---|---|---|---|---|---|
| Price | $175.40 | $109.16 | $290.68 | $220.52 | $244.68 | $507.12 |
| Market cap | $423B | $113B | $103B | $81B | $251B | $3766B |
| Revenue, TTM | $7.3B | $15.4B | $5.4B | $4.0B | $5.4B | $346B |
| Revenue growth, TTM | +87% | +22% | +32% | +32% | +24% | +18% |
| Gross margin | 82% | 73% | 67% | 80% | 75% | 68% |
| GAAP operating margin, TTM | 45.6% | 9.7% | -22.8% | 0.4% | -2.5% | 47.1% |
| Free cash flow margin, TTM | 56% | 31% | 22% | 30% | 30% | 17% |
| EV / sales | 56.6× | 7.7× | 18.6× | 20.4× | 45.7× | 10.9× |
| EV / EBIT | 123.9× | 79.9× | n/m | n/m | n/m | 23.1× |
| P/E, trailing | 115.2× | 78.4× | n/m | 457.4× | n/m | 26.4× |
Two readings. Against the high-growth names, Palantir is the only one that is both growing faster and already earning a large GAAP margin; Snowflake, Datadog and CrowdStrike grow at 24 to 32% with GAAP margins at or below zero, and they trade at 19 to 46 times sales. Against Microsoft, which has the margin Palantir aspires to, Palantir trades at five times the EV/sales multiple and five times the EV/EBIT multiple. The first comparison says the premium is earned on today’s numbers; the second says the premium is worth only what the next decade delivers. Both are true. ServiceNow is the cautionary row: the best-run application software company of the last decade, growing 22% at a 10% GAAP margin, is worth 7.7× sales.
Stoxa valuation runs for the DCF rows; Monte Carlo 5th to 95th percentile; relative valuation from the workbench’s peer multiples (EV/sales to price-to-free-cash-flow); sell-side targets as reported after the November 2026 results (RBC $130 to Citi and Barclays $265, average about $228).
What would make us wrong
Upside risks to our base case. Net dollar retention of 165% means the existing customer base alone, with no new logos, would grow revenue 65% next year; if that number holds for even three years, our base case is too low. US commercial, at 148% growth, is 43% of revenue and rising; the mix shift toward the fastest segment lifts the blended rate. International commercial is 8% of revenue and growing 21%; Europe and Asia have not been sold to in earnest, and the sovereign-AI programmes management described are a new channel. The government business has a structural tailwind in US defence software spending, and Maven is now available to every service. The tax rate will be below 25% for longer than our convergence assumes while carry-forwards last. And if the company chose to run at its adjusted margin, by cutting stock compensation as the share price makes it expensive, the GAAP margin could reach the high fifties.
Downside risks. Remaining deal value grew 2% in the quarter and the US commercial book grew 4%; if the fourth quarter shows the same, the growth deceleration our bear case assumes starts in 2027 rather than 2028. The model labs are moving into the application layer (management was asked about Anthropic directly on the call), and the hyperscalers’ own agent platforms compete for the same budgets; a price war in enterprise AI tooling would hit the margin and the growth at once. Customer concentration in the US government, 41% of revenue, carries budget and political risk in both directions. Dilution is a cost the GAAP margin captures but the share count does not: on the 2.57 billion weighted diluted shares rather than the 2.41 billion outstanding, every value in this analysis is 6% lower. And the stock itself, with 59% annualised volatility and a regression beta of 2, fell on the day after three of its last five earnings reports, every one of them ahead of guidance.
Method and how to reproduce this
Every number above comes from the Stoxa API on the data as of 2026-11-03: company fundamentals from SEC EDGAR company facts with filing provenance, prices from the nightly price store, the ten-year Treasury yield from the macro store, Damodaran’s equity risk premium and sector data as bundled with the workbench, and the valuation engine for every run. One engine executes the point estimates, the reverse DCF, the sensitivity grids and the Monte Carlo, so they cannot disagree with each other. Street figures (segment revenue, bookings, retention, guidance, consensus estimates and price targets) are from the company’s release and call and from published estimate summaries, and are marked as such.
To reproduce the base case, open PLTR in the workbench, switch beta to bottom-up, set initial revenue growth to 70% with eight years to terminal growth, initial operating margin 46% and target 45% with six years to target, sales-to-capital 3.0 and terminal ROIC 25%, then save it as a scenario. Or run it from Python with the Stoxa SDK:
from stoxa import equities

a = equities.default_assumptions("PLTR")
a.wacc.beta_method = "bottom_up"
a.revenue_growth.initial, a.revenue_growth.fade_years = 0.70, 8
a.operating_margin.initial, a.operating_margin.target = 0.46, 0.45
a.operating_margin.fade_years = 6
a.reinvestment.sales_to_capital = 3.0
a.terminal.roic = 0.25
r = equities.value_company("PLTR", assumptions=a)
print(r.value_per_share, r.upside)          # 99.56, -0.432
The theory behind each step is in Learn: the reverse DCF, the cost of capital, terminal value and the growth-reinvestment link, and sensitivity and Monte Carlo. Our previous analysis, Western Digital, applies the same method to a cyclical business where the margin, not the growth, is the question.
This analysis is for information and education. It is not investment advice, a recommendation, or an offer to buy or sell any security, and it may be wrong. The authors hold no position in Palantir or the companies named at publication. Figures are as of the dates stated and will change; the workbench will show different defaults as new filings and prices arrive.