
Screenshots from the Stoxa app on 2026-11-02. Figures in them are examples from that date and will differ from current output.
A screen is a set of rules; a backtest asks how those rules would have done if you had followed them in the past. Stoxa runs both on the same engine and the same point-in-time data, so a historical screen sees only what had been filed by that date. This guide builds one screen, runs it, saves it, and backtests it. The theory behind each number is in Screening and Reading a backtest.
Open the Screener and pick a universe
The Screener is the first item in the app’s top bar and the page you land on after signing in. Start with the universe picker under the rules: it sets the starting population before any rule applies. liquid (price at least $5 and market cap at least $300M) is a good default; large cap, mid cap and small cap are size bands, and all is everything. Universes you save yourself appear under “saved”.
Build your filters
Each row is one rule: a field, an operator and a value. Fields are listed with their category in brackets, such as ROIC (profitability), P/E (TTM) (valuation) or P/E (TTM) percentile in industry (higher = cheaper) (relative). Numeric fields take <, <=, >, >=, =, ≠ or between; text fields such as Sector take in, not in, = or ≠. The examples above the rules load a ready screen, such as “Cheaper than industry on P/E and EV/EBITDA”.
Ratios are fractions: ROIC above 15% is > 0.15. Money fields are in dollars: market cap above $10 billion is > 10000000000. Percentile fields run from 0 to 100, higher always better. + add filter adds a row, ✕ removes one, and a row with no value is ignored. All rows must hold at once; + or on a row adds an alternative, and the pair passes when either holds. The line under the builder states exactly which rules will run.
The relative fields compare a company with its peers: “P/E percentile in industry >= 70” keeps the cheapest 30% of every industry, so a value screen is not filled with one cheap sector.
Run the screen and read the funnel
Press Run screen. Above the rules, start shows how many companies the universe holds; at the right of each rule, the arrow shows how many are left after it and every rule above it. The rule that cuts the most is the one that defines your screen; a rule that removes almost nothing can usually go. Missing values fail a rule, so a field few companies report can quietly halve the list.
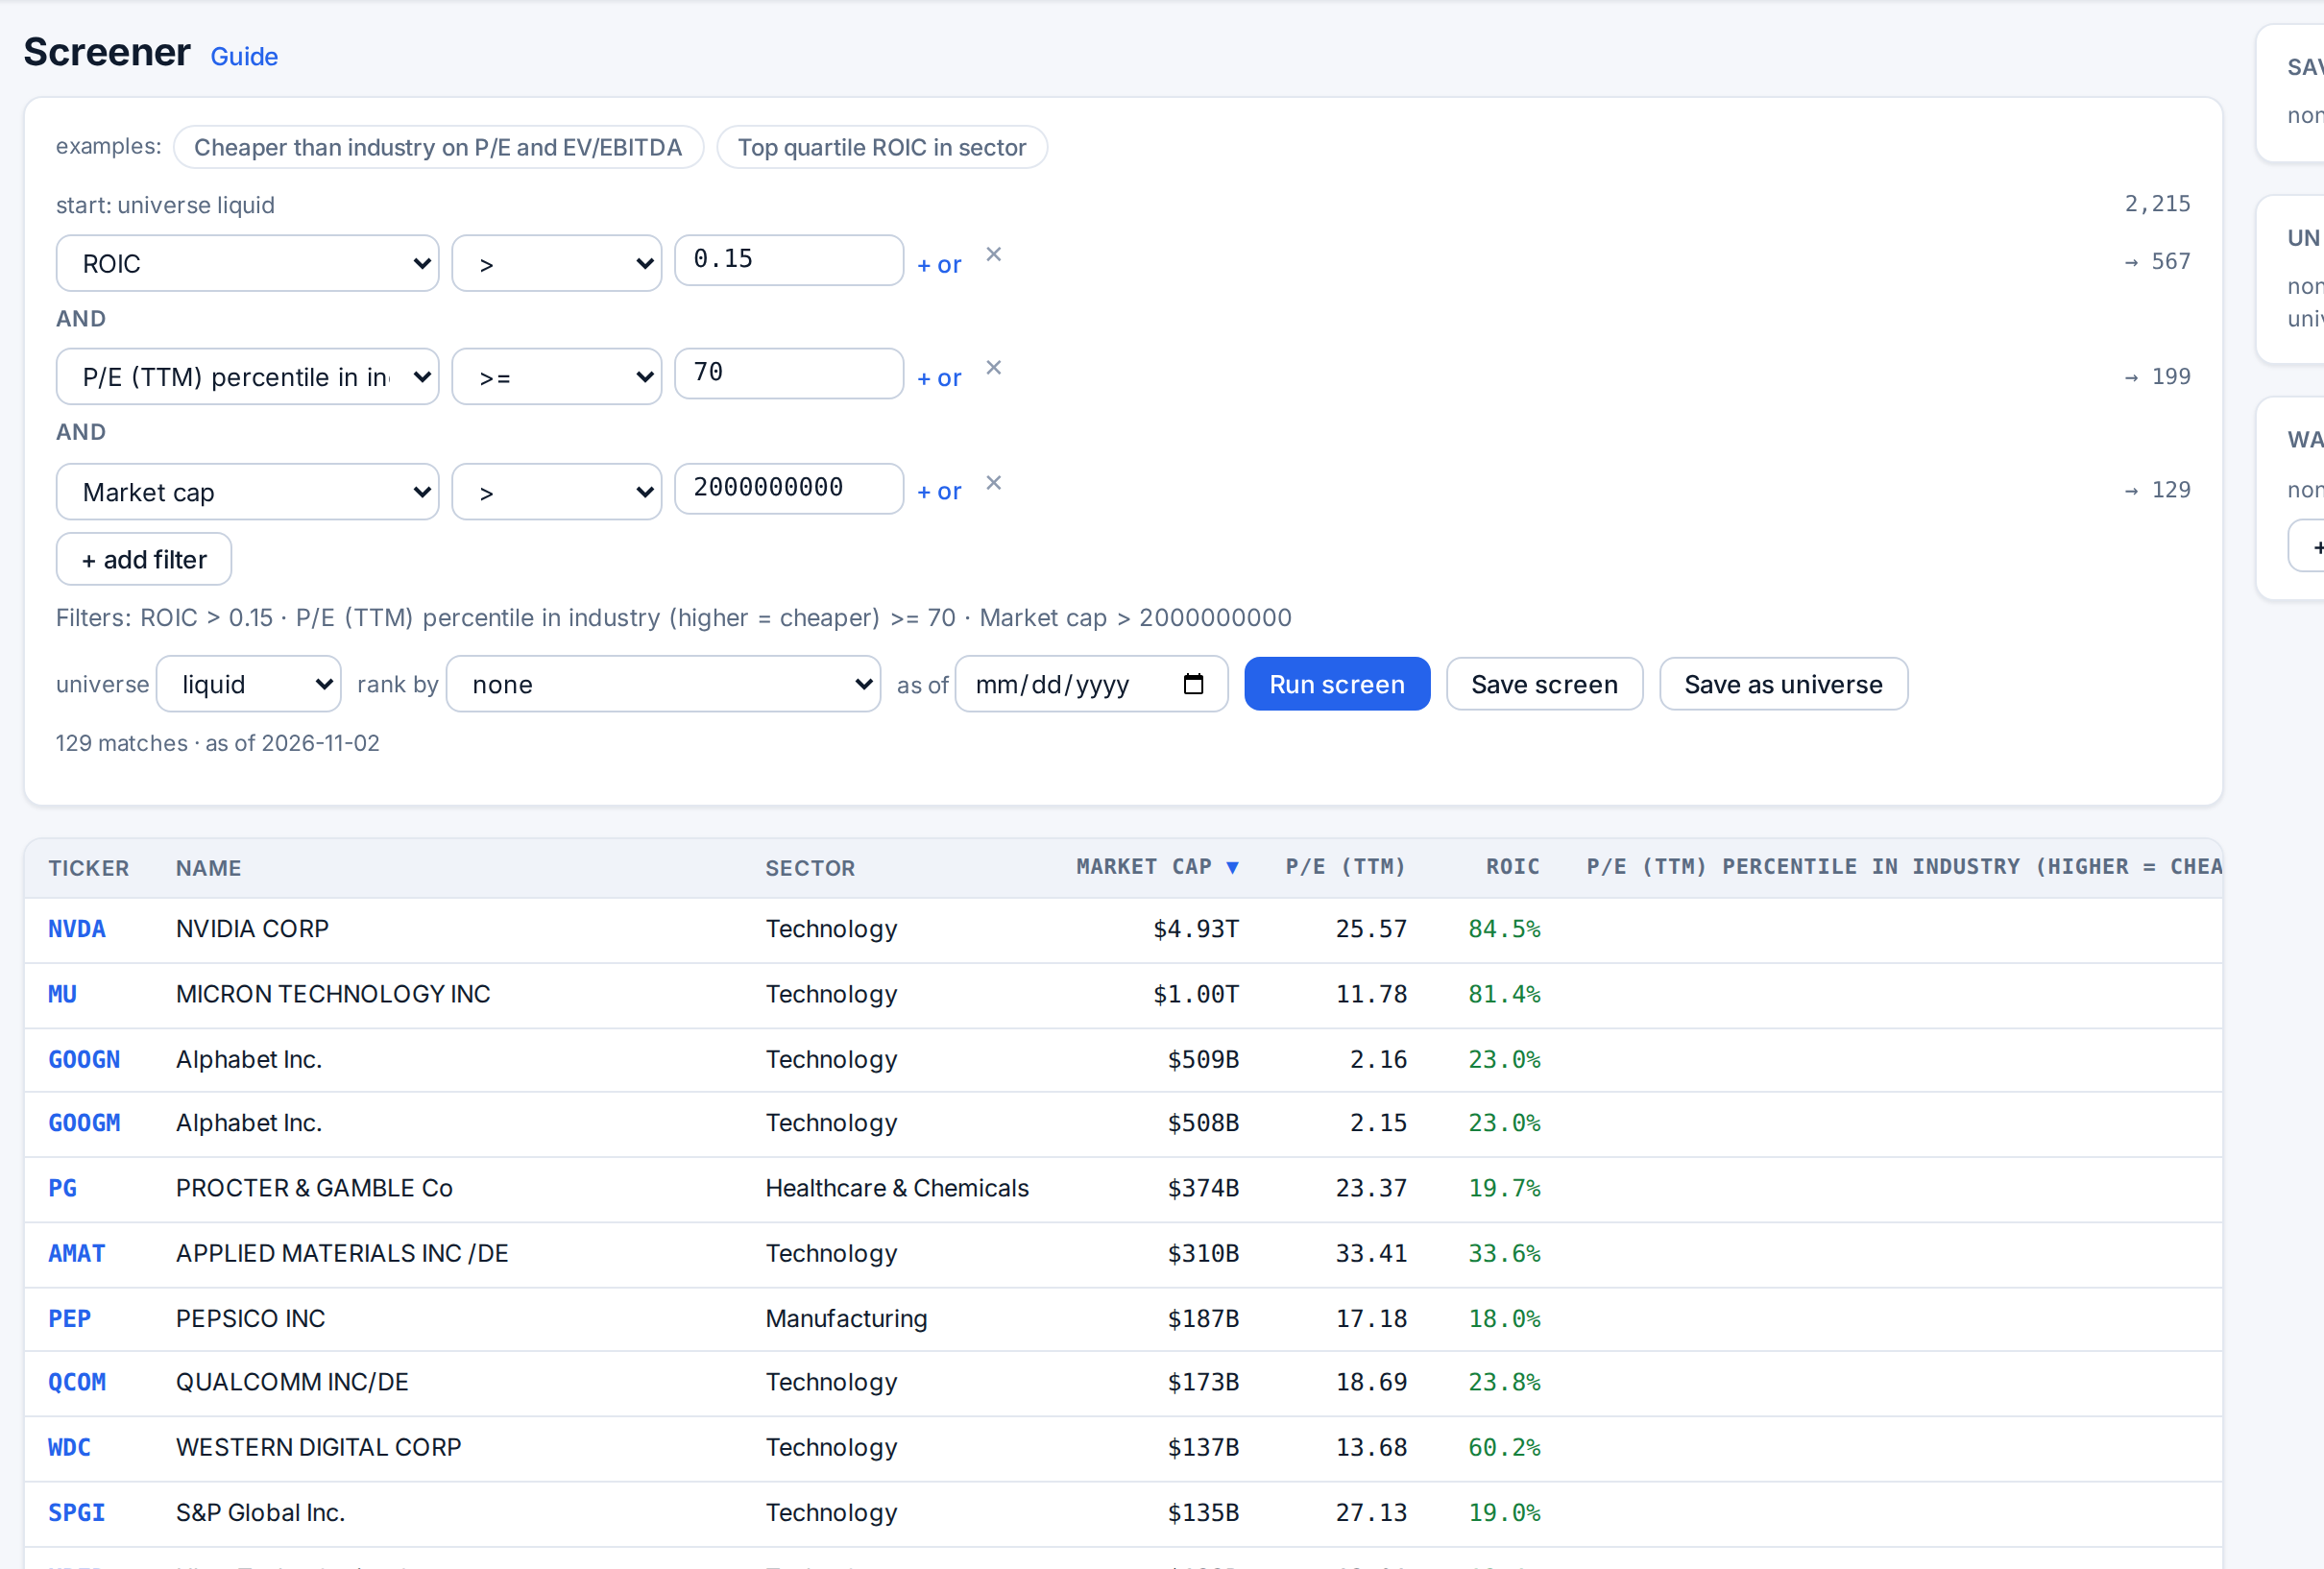
Results show ticker, name, sector, market cap, P/E and ROIC, plus a column for every field you filtered on. Click a column header to re-sort and a ticker to open its company page. Results are as reported, so an odd figure is usually an odd filing; check it with the line-item i panel described in How to value a stock in Stoxa.
Screen the past with an as-of date
Leave as of empty for today. Set a date to run the same screen as it would have looked then: prices from that date and only the financial facts that had been filed by it, as filed then, before any later restatement. The results line shows the as-of date used. The first screen for a new date can take a little longer while that day’s snapshot is built.
Save screens, universes and watchlists
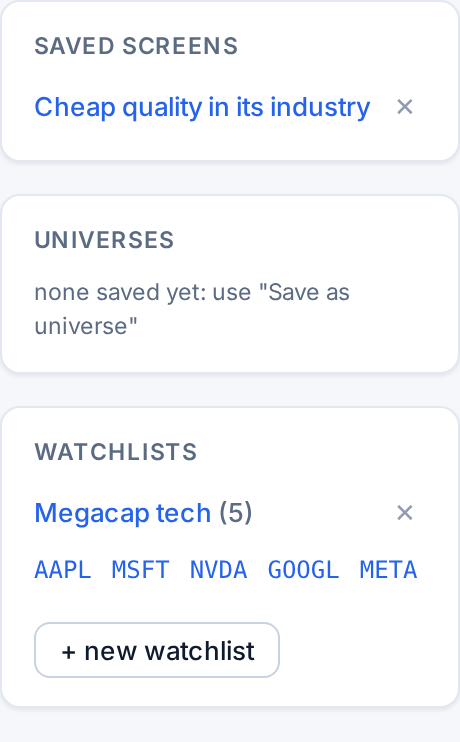
Save screen stores the universe, the rules and the as-of date. Save as universe stores the universe plus the rules as a new starting population, for other screens, backtests and simulations. Both lists sit on the right with the watchlists; click an entry to load it, ✕ to delete it.
Set up a backtest
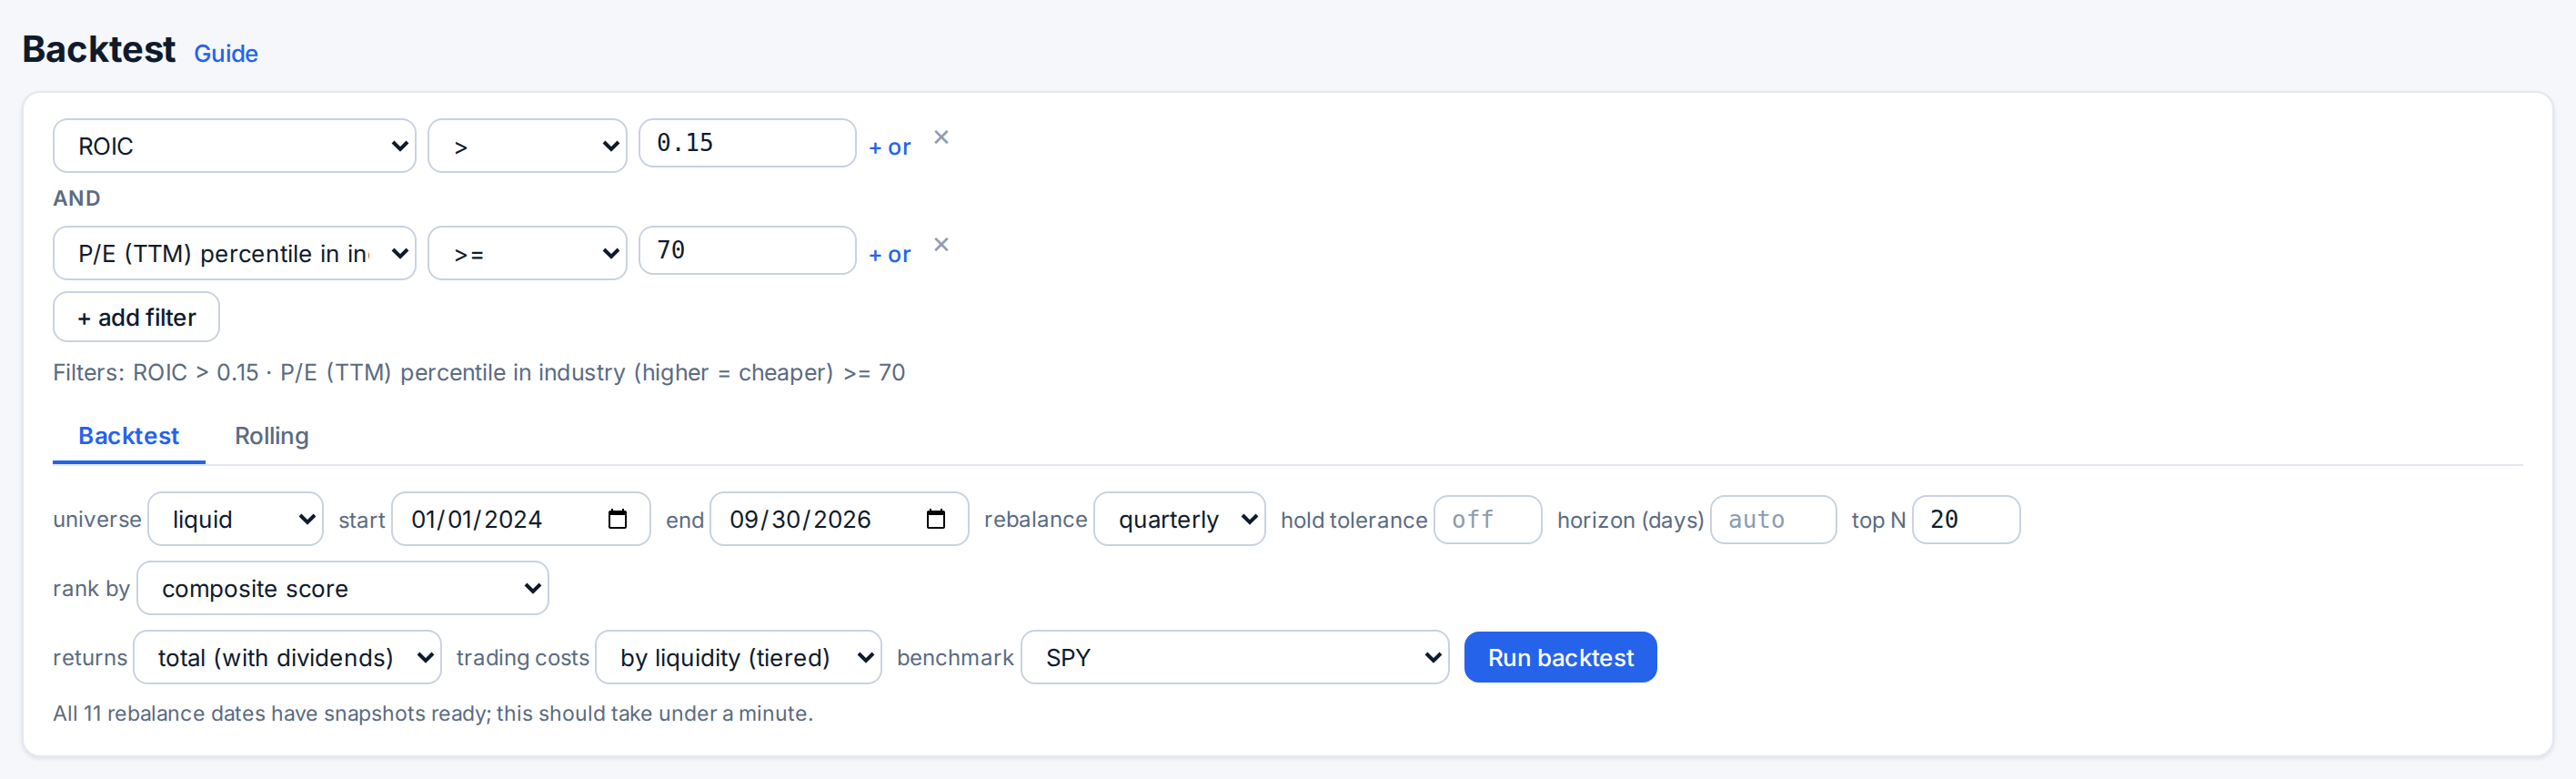
Open Backtest in the top bar. The filter builder works exactly as in the Screener. Below it, on the Backtest tab:
- universe, start and end: the population and the test window (six years to today by default).
- rebalance: weekly, monthly, quarterly (default) or annually. The screen is re-run at each period end and the basket held until the next one.
- hold tolerance: keep a holding while it still ranks within top N plus this many, instead of replacing the basket each time. It cuts turnover.
- horizon (days): leave blank to hold until the next rebalance; a number overrides it.
- top N and rank by: how many companies to hold and which score picks them, the composite factor score or a ranking system (see How to build a ranking system).
- returns: total (with dividends) by default, or price only.
- trading costs: by liquidity (tiered) by default, which charges 0.08% to 4% per trade depending on the stock’s dollar volume; also fixed %, square-root impact and none. See Transaction costs.
- benchmark: SPY, the equal-weight universe (every stock in your universe at equal weight, slower), or none.
The line under the button estimates the run time: dates that have no point-in-time snapshot yet are built first.
Run it
Press Run backtest. At each rebalance date Stoxa runs your screen as of that date, keeps the top N by the chosen score, and holds them at equal weight to the next date, with dividends and with trading costs on the names that enter and leave. A company with no price after the date drops out of that period; nothing is filled in. The run continues if you leave the page, and recent runs are listed at the bottom.
Read the statistics
The first row is the result: CAGR, Total return, Max drawdown, Volatility, Sharpe, Sortino and Calmar. The second compares it with the benchmark and shows how it traded: Alpha, Beta, Info ratio, Hit rate, Up / down mkt (average excess in rising and falling benchmark periods), Avg turnover, Cost drag and Best / worst period. The chart shows the equity curve from 100 against the benchmark, and the drawdown below it.
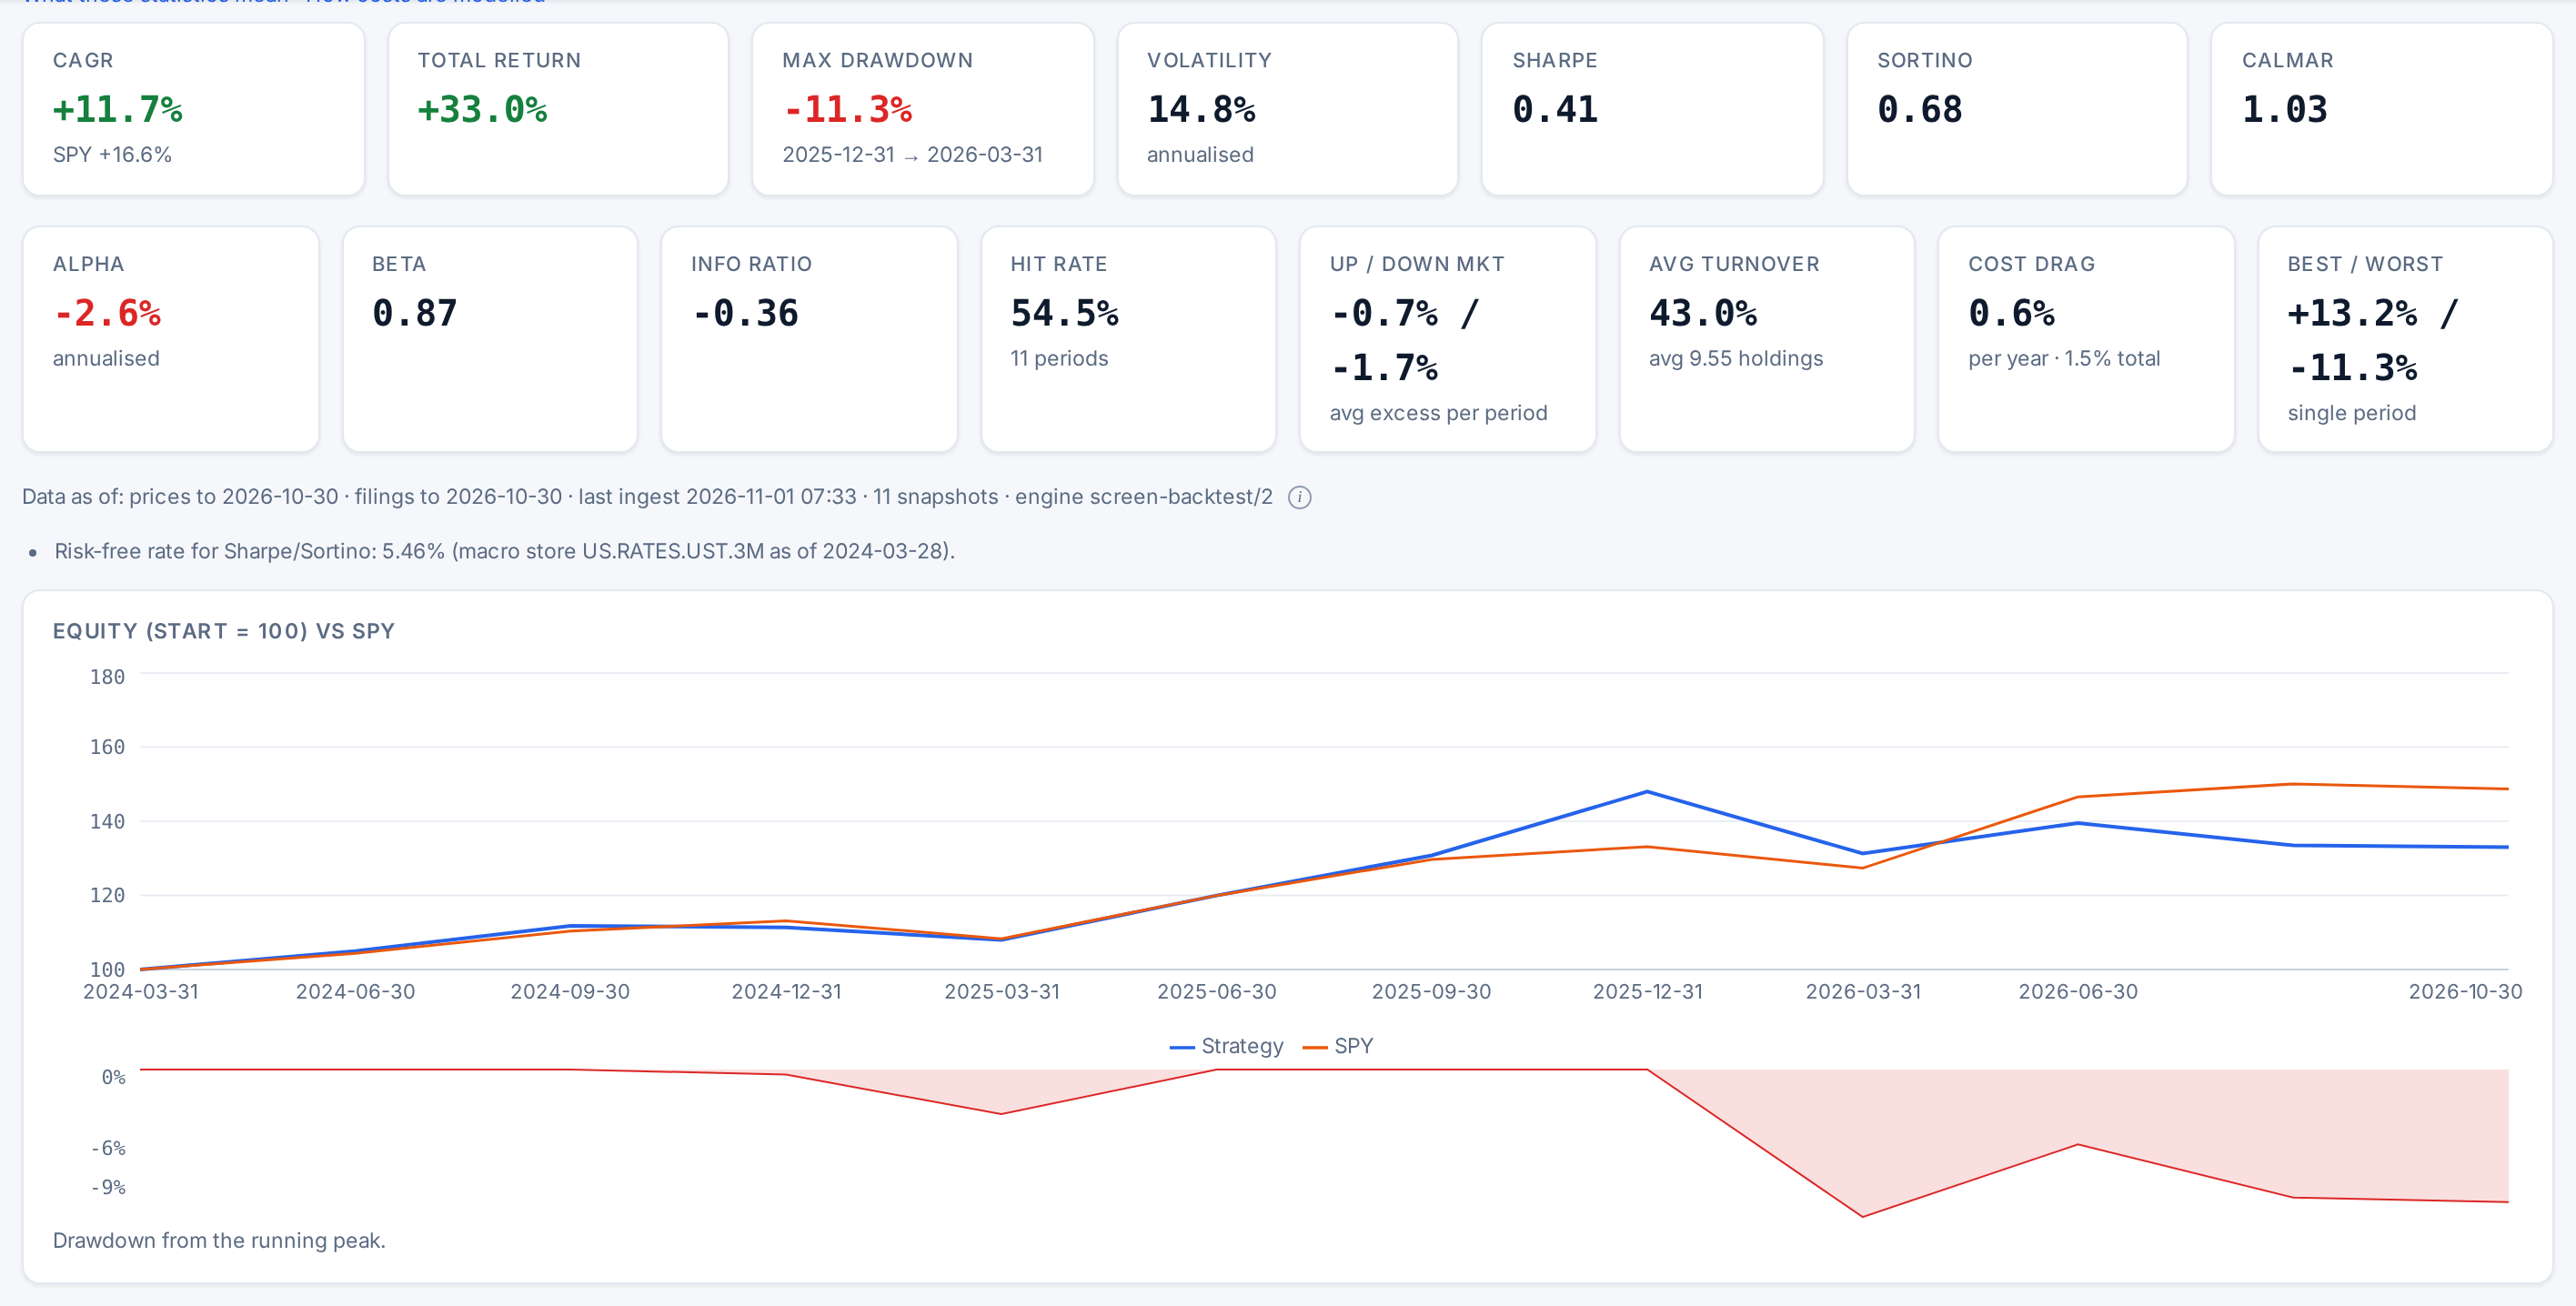
Look at the cost drag next to the excess return: if costs eat a large part of it, the edge sits in names that are expensive to trade. Every statistic is defined, with its formula, in Reading a backtest.
Look at what was held
The table under the chart lists each period: the rebalance date, the date held to, the number of holdings, names in and out, turnover, the gross return, the cost, the net return, the benchmark and the tickers. Check whether a result rests on one or two names or one or two periods. The “Data as of” line records the data vintage: the same rules on the same vintage always give the same numbers.

Check the result across start dates
One backtest is one path through history. The Rolling tab starts a new test every step (new window every month, say) and holds each for a fixed time (hold for 3 months), then shows the spread: Windows, Mean, Median, the 10th / 90th pct, Best and Worst, how often the strategy beat the benchmark, and a histogram of window returns. A result that only works from a few start dates is fragile.
Test whether the result is real
Compare with the equal-weight universe benchmark as well as SPY: beating it means the rules picked better stocks than chance from the same pool. Then change one thing at a time: move the dates by a year, switch the rebalance frequency, nudge each threshold. A rule that only works at one exact setting has probably been fitted to the past. Watch the counts too: a period with two or three companies is a bet on those companies, not a test of a rule.
Known simplifications: the basket is re-formed at equal weights every period, and fills are at the rebalance-date close. To run the rules as a real portfolio, with sell rules, stops and cash, use the simulator: How to simulate a strategy. A past result does not predict a future one.
Add the macro regime, then go deeper
The macro fields (10-year yield, 2s10s spread, CPI, unemployment, high-yield spread, Sahm rule, yield-curve state, recession signal) hold one value per date, the regime as known then. A filter on them keeps or drops a whole rebalance, so you can test a rule only in, say, inverted-curve quarters.
Screens and backtests are also available through the Stoxa SDK and REST API, for notebooks and agents: see Stoxa for developers.