
Screenshots from the Stoxa app on 2026-11-02. Figures in them are examples from that date and will differ from current output.
The simulator runs your rules as a portfolio, day by day: positions are bought once and held until a sell rule, a stop, the hedge or a delisting closes them, with cash, dividends and costs on the trades actually made. This guide builds one strategy from the top of the Simulate page to the trade list. Every engine rule, and what is not modelled, is in Portfolio simulation.
Set the general options
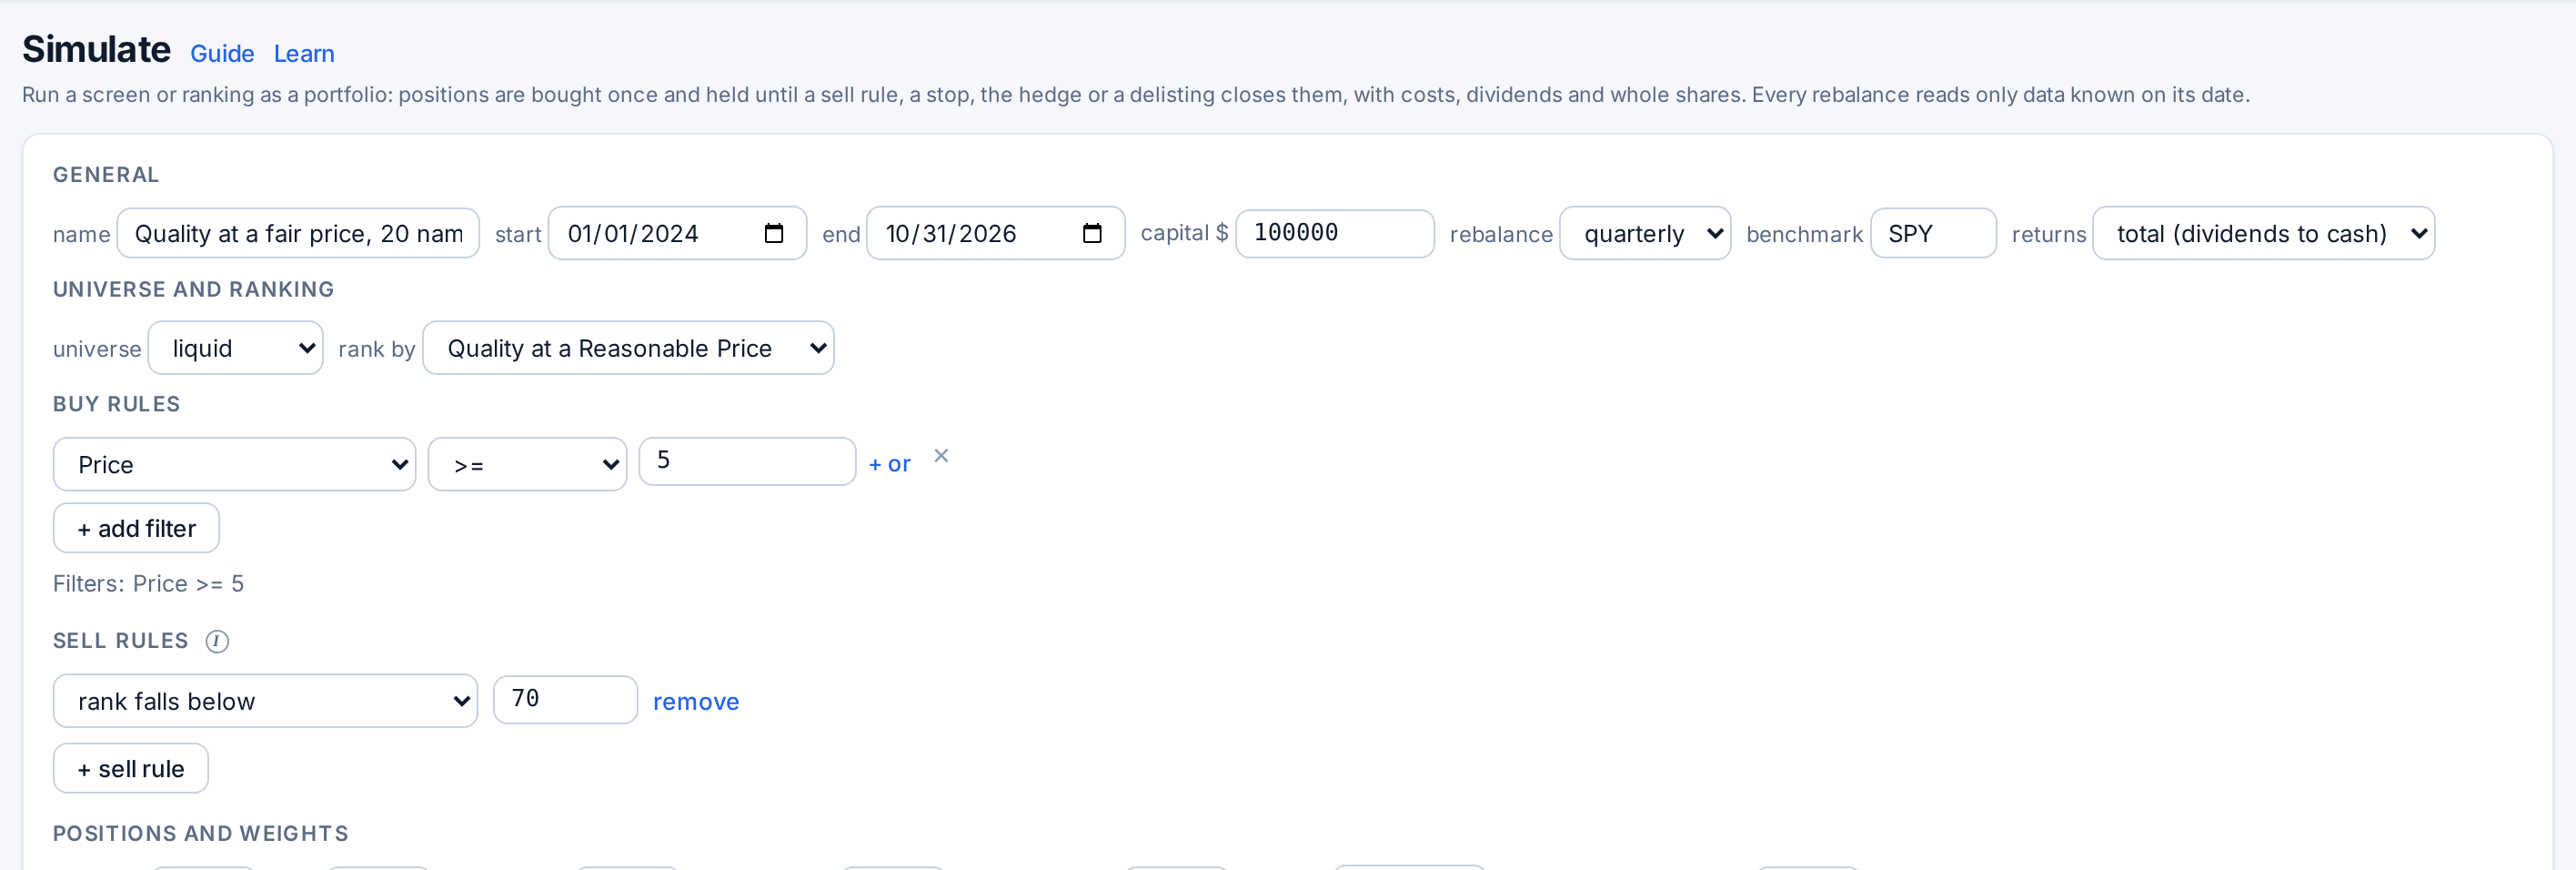
Open Simulate in the top bar. Under General: a name, start and end, the starting capital, the rebalance frequency (when buy and sell rules are checked), the benchmark and the returns type, total (dividends to cash) by default.
Choose the universe, the ranking and the buy rules
Under Universe and ranking, pick a universe and a rank by system; candidates are bought best rank first. Under Buy rules, the filter builder works as in the Screener: every rule must hold for a stock to be a candidate. With no buy rules, every stock in the universe is a candidate.
Add sell rules
Under Sell rules, + sell rule adds one. A holding is sold at a rebalance when any rule holds, and the first matching rule is recorded as the reason. The kinds: rank falls below, rank position above (both need a ranking), no longer passes the buy rules, field condition, gain since entry (%), days held and % from high since entry. “Rank falls below 70” with a top-20 portfolio keeps winners that slip a few places and sells real deterioration, which trades far less than re-forming the top 20.
Set positions, weights and caps
Under Positions and weights: positions is the target number of holdings, max allows extra ones while cash covers a full position, min cash % is never invested, sector cap % and industry cap % skip a candidate that would take its group above the cap, weights is equal or rank, and buyback cool-off (days) stops a stock sold today being bought back next week.
Add stops and a hedge, if you want them
Under Stops, trailing % sells when a holding closes that far below its highest close since purchase, entry % when it closes that far below the purchase price, and time (days) after a holding period. Stops are checked daily on closes.
Under Hedge, tick hedge sleeve, set the vehicle (cash or an ETF ticker) and the ratio %, then enter when: benchmark below its moving average (200 days is the classic setting) or a macro condition such as the Sahm rule. By default the hedge exits when the entry condition no longer holds.
Set costs and run
Under Costs, slippage is by liquidity (tiered) by default; add a commission $ per trade and a percentage if your broker charges one. Check validates the strategy and lists any problem with the setting at fault; Run simulation runs it as a job (you can leave the page); Save strategy keeps it in Saved strategies at the top.
Read the equity curve and the drawdown
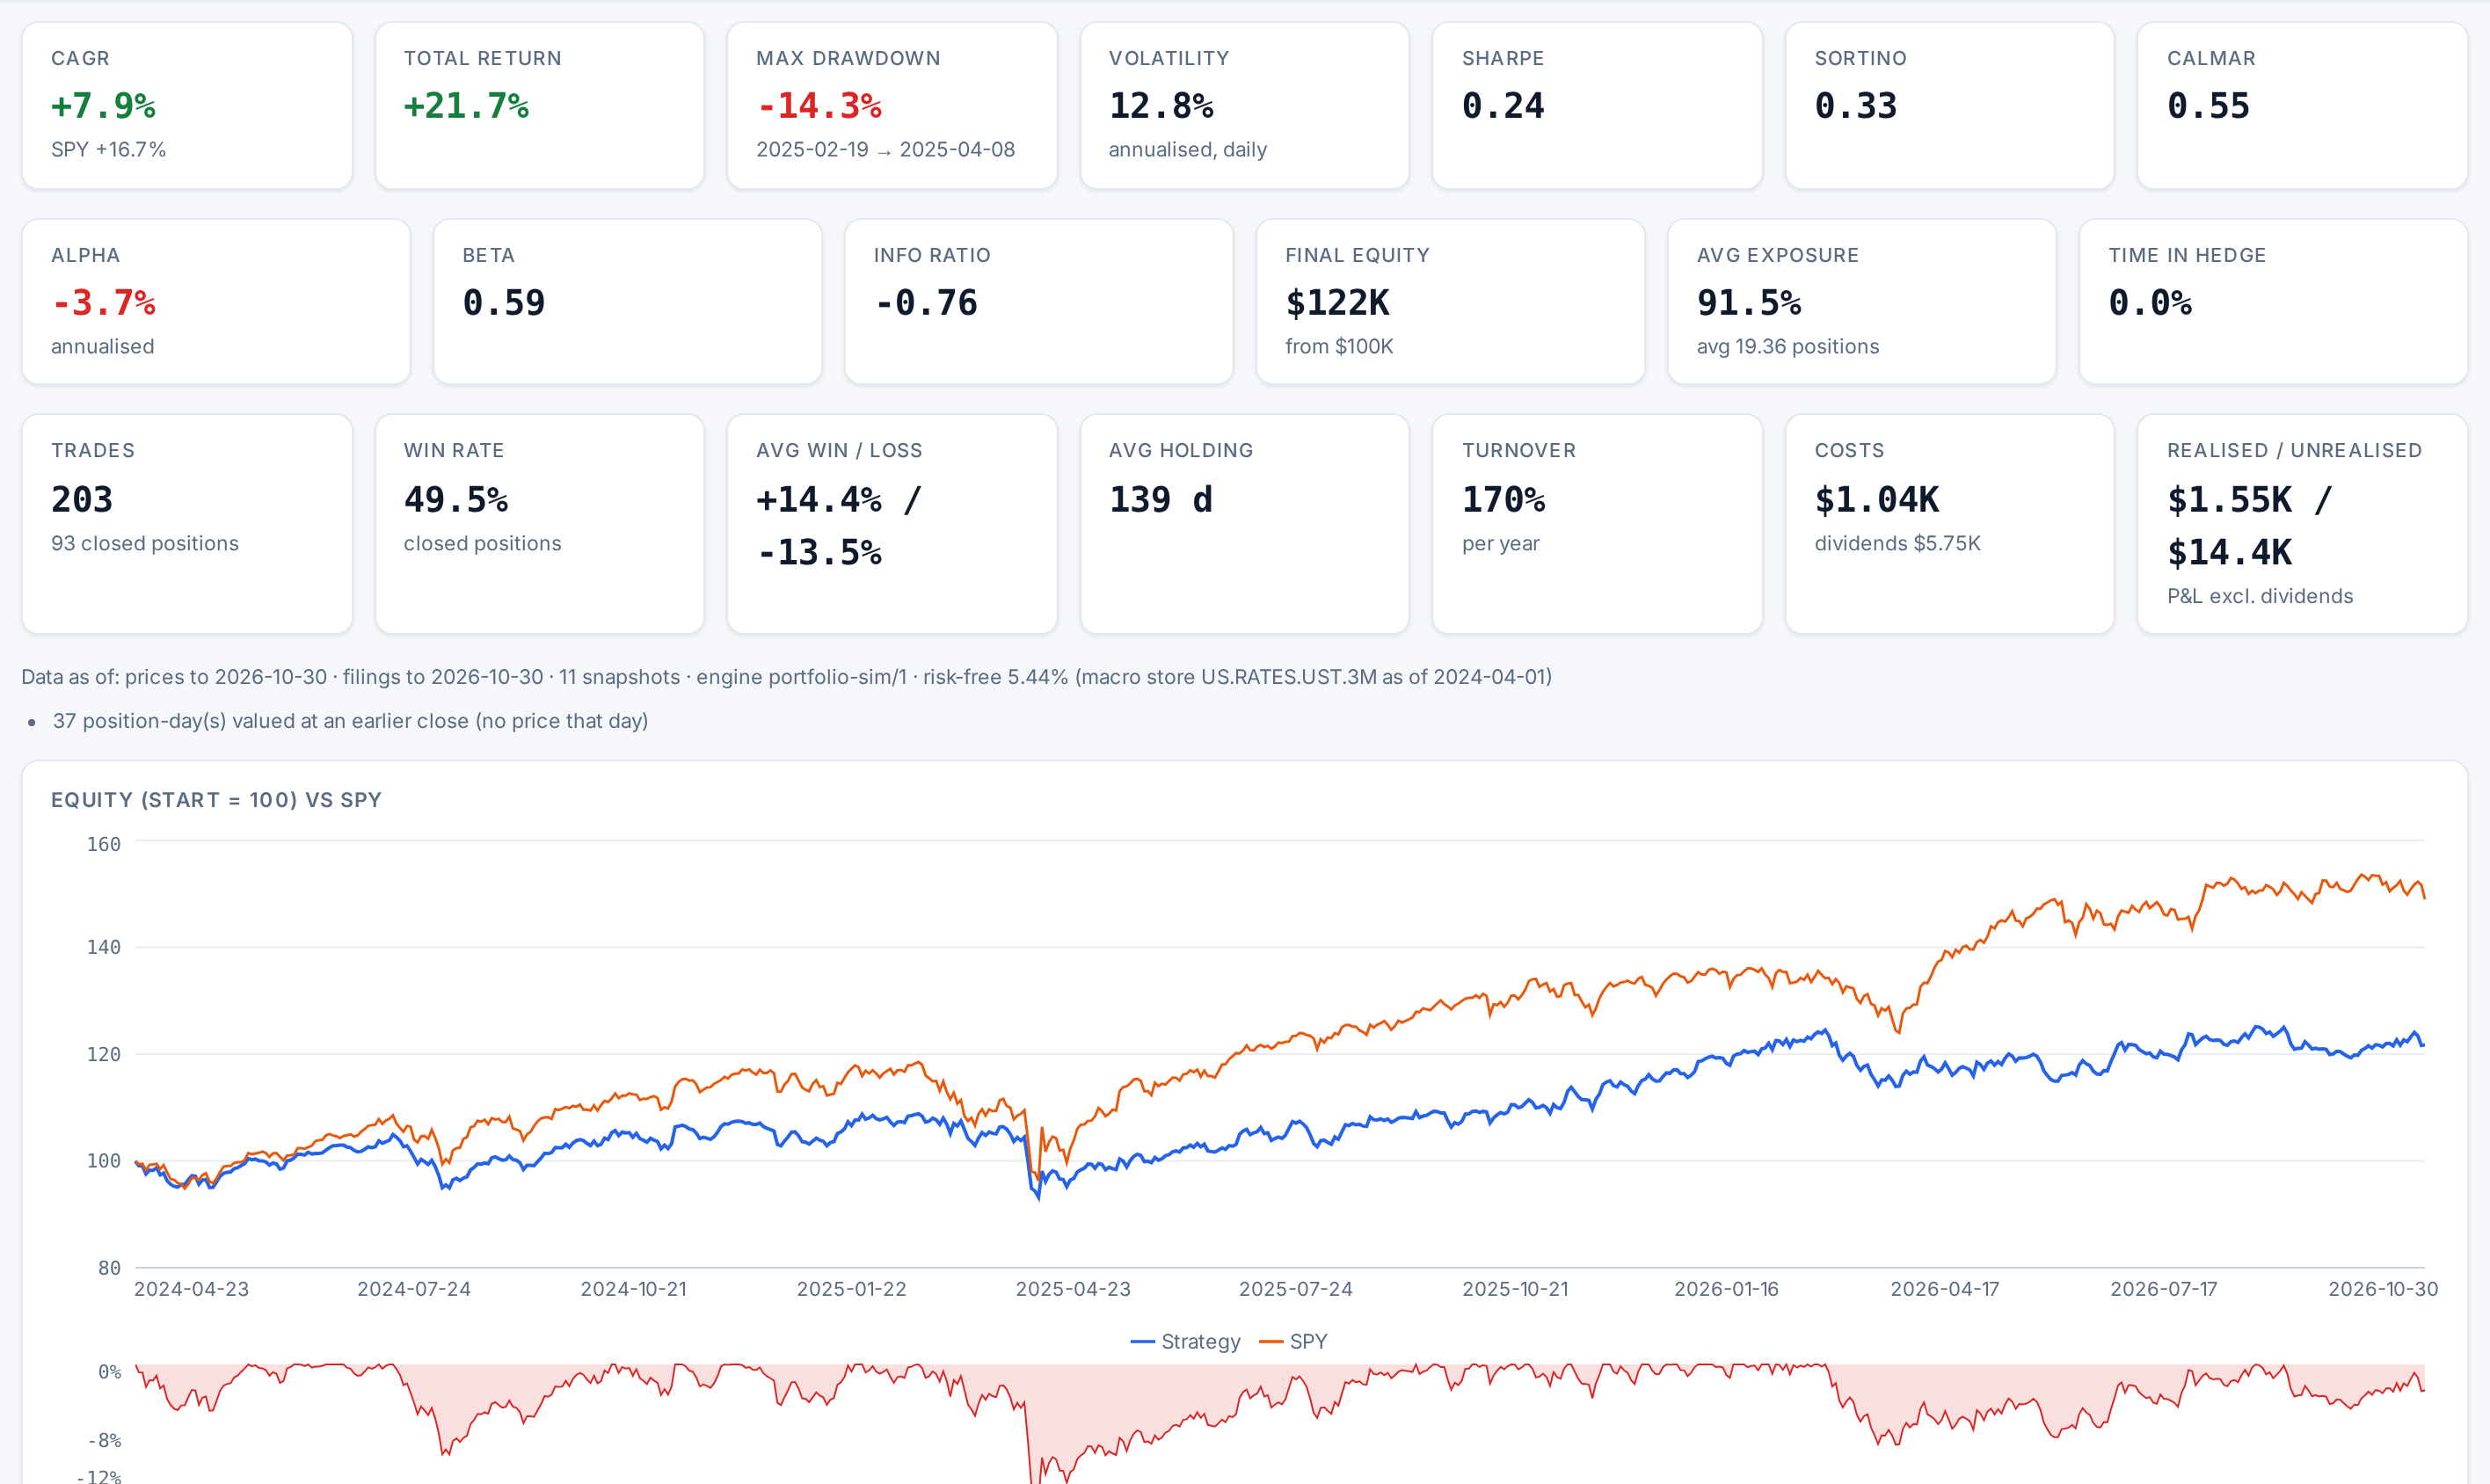
The chart shows the portfolio from 100 against the benchmark, with hedged stretches shaded, and the drawdown from the running peak below it. The statistics follow the backtest’s (CAGR, Max drawdown, Sharpe, Alpha, Beta…) plus the portfolio’s own: Final equity, Avg exposure, Time in hedge, Trades, Win rate, Avg win / loss, Avg holding, Turnover, Costs and Realised / unrealised.
Read the trades
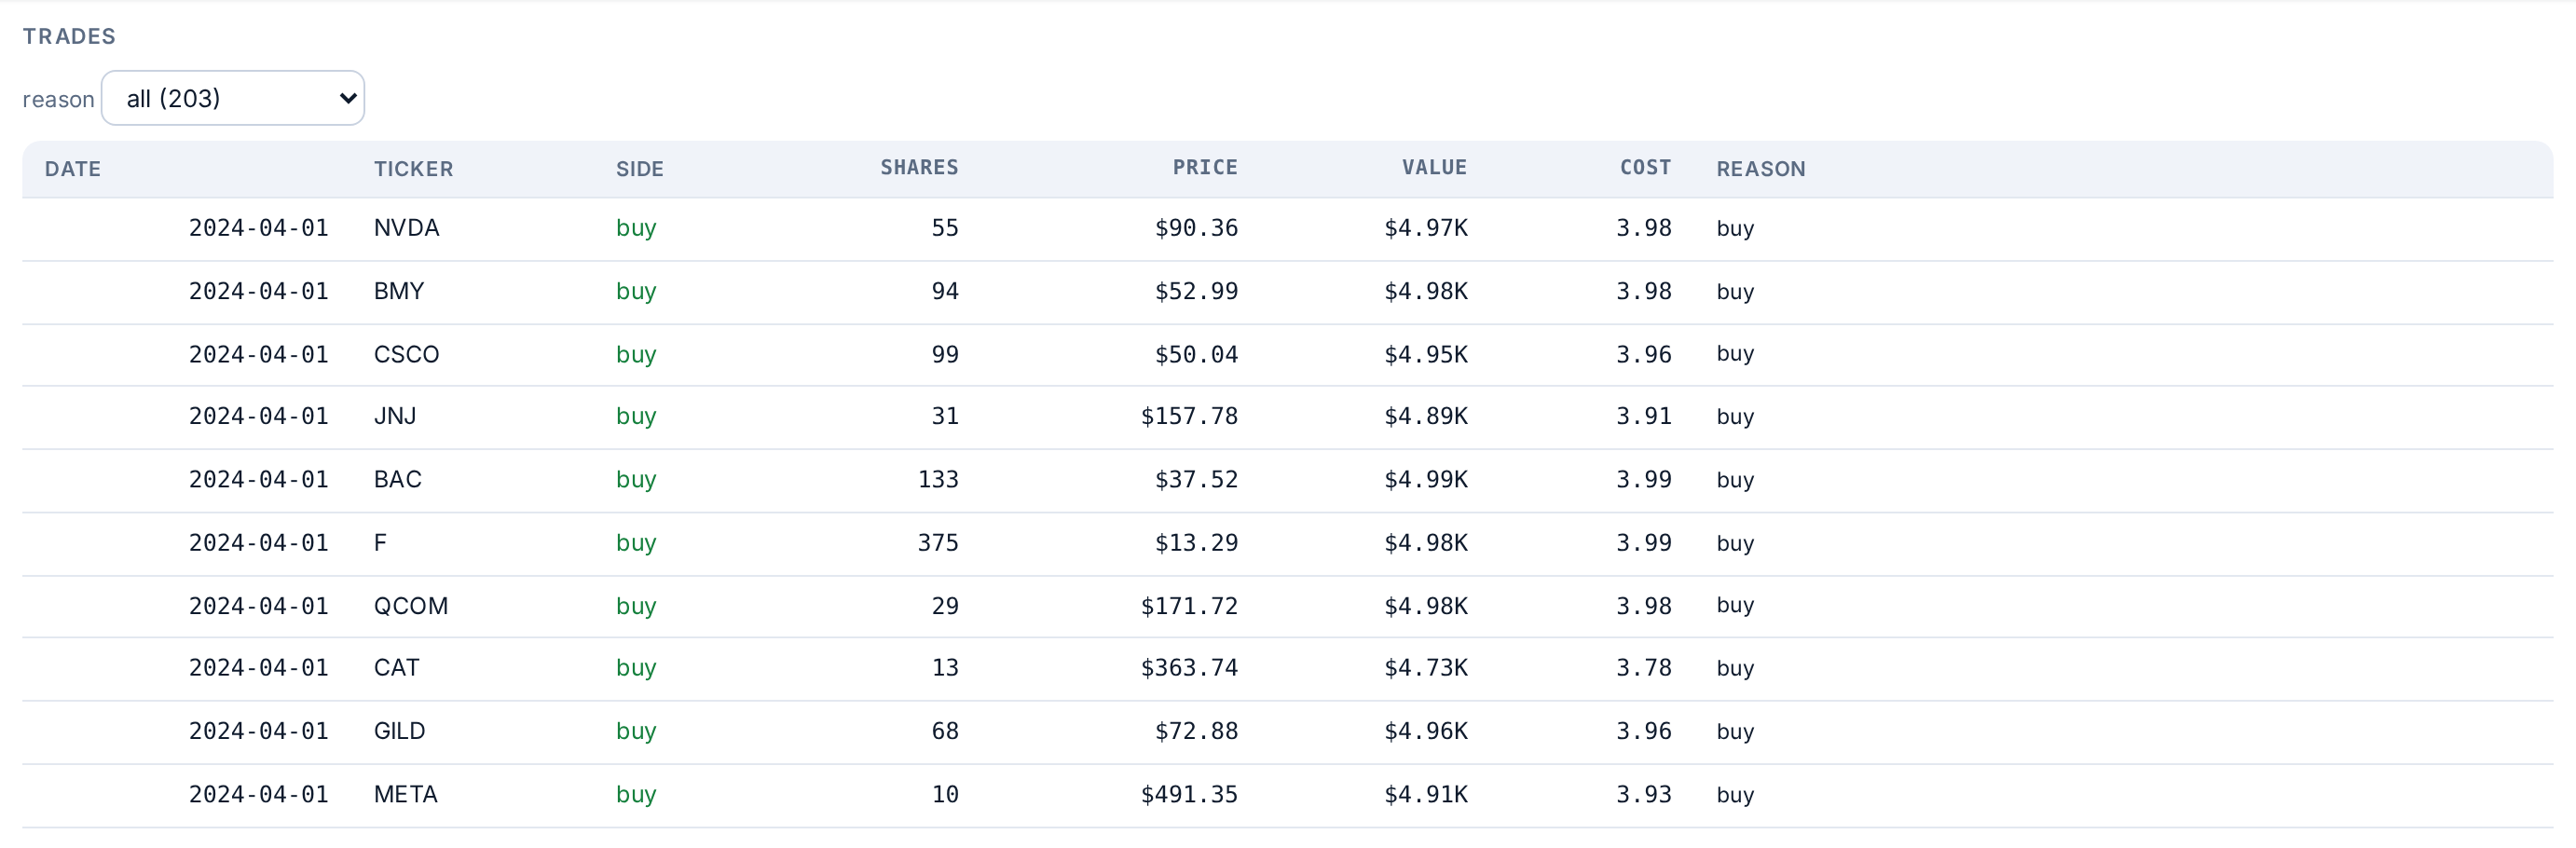
Trades lists every buy and sell with its date, shares, price, cost and Reason: the sell rule that fired, a stop, a delisting, a trim or the hedge. Holdings shows the portfolio after each rebalance, and Per rebalance period the return, benchmark, excess and turnover of each period. If a stop doubles the trade count without improving the drawdown, it is not helping.
Eight ready-made strategies built with these same settings are tracked live: see How to follow a house strategy.